We use cookies to improve your experience and analyze site usage. Privacy Policy
Track Every Trade. Optimize Every Cycle.
A full trading lifecycle suite — from brokerage import to trade journaling, roll management, and performance analytics.
Sync Your Brokerage. Track Everything.
Connect once and automatically import your positions, dividends, and trade history — no spreadsheets, no manual entry.
Portfolio & Positions
Holdings, cost basis, and real-time market value across all linked accounts.
Dividend Income
Ex-dates, pay dates, and amounts auto-imported so you never miss a payment.
Trade History
Options activity parsed into CSP/CC trades with strike, premium, and expiration.
Supported Brokerages
Powered by SnapTrade · Read-only access · 256-bit encryption
Trade Journal. Track Every Cycle.
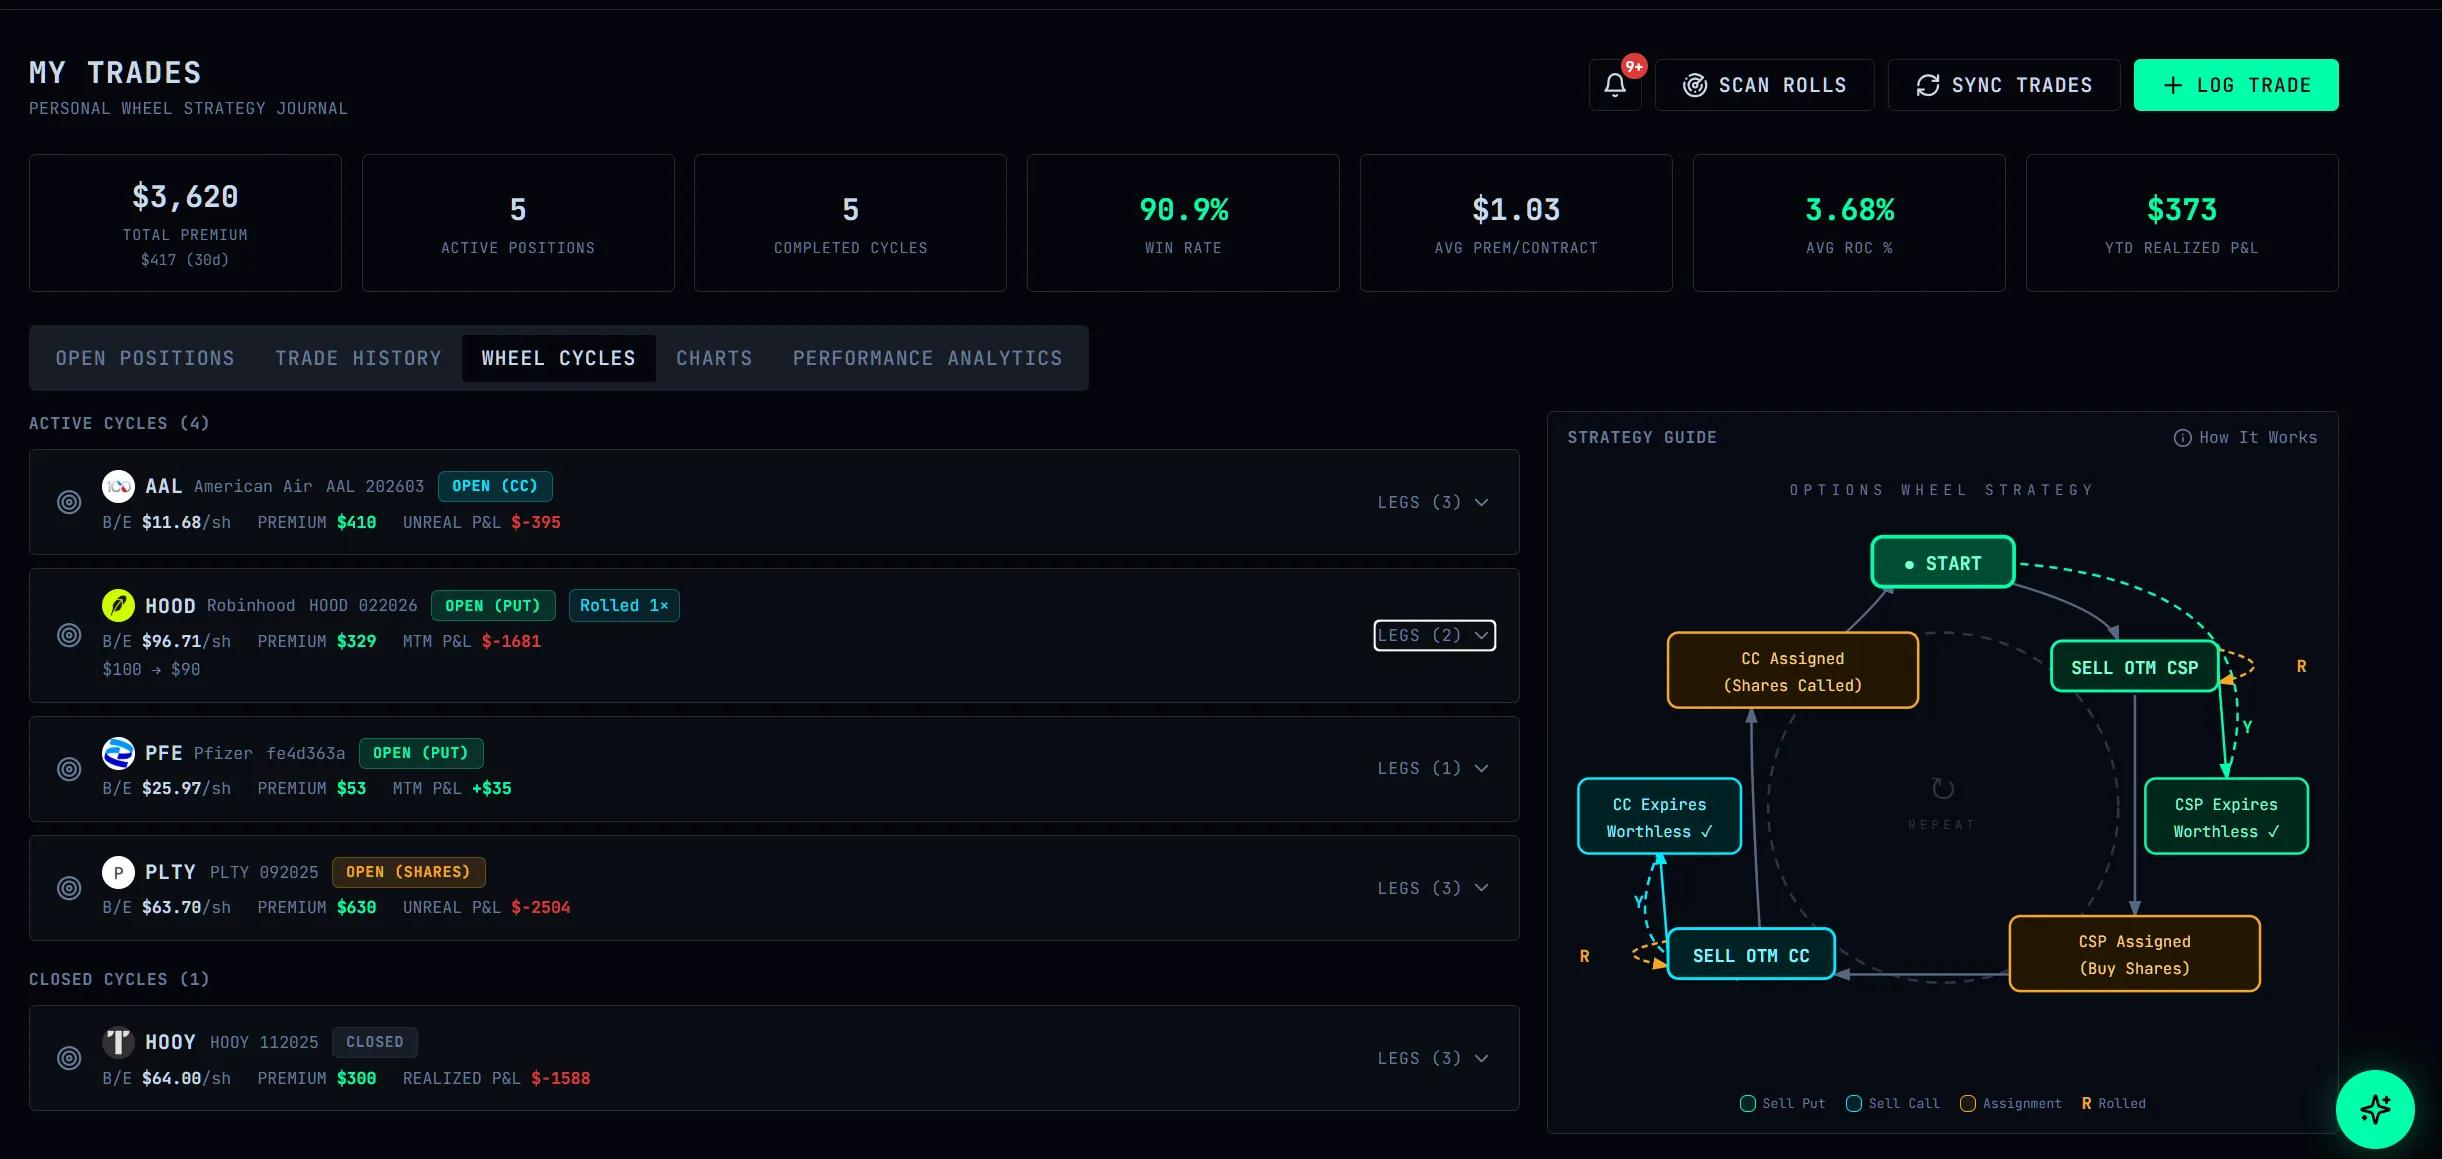
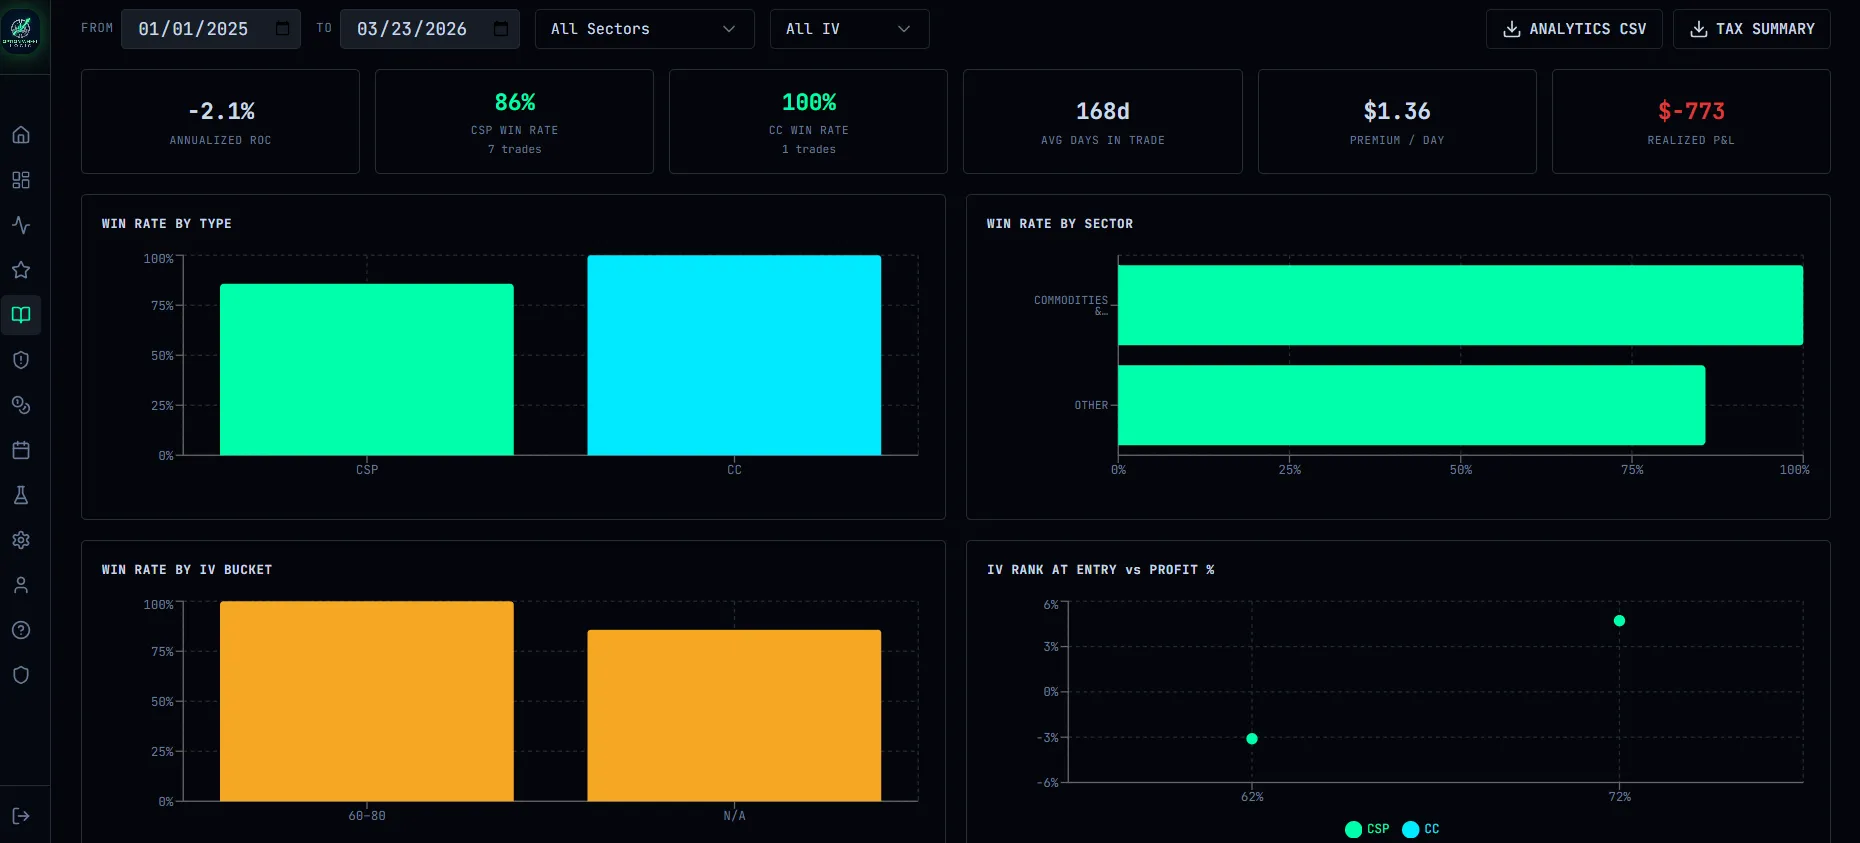
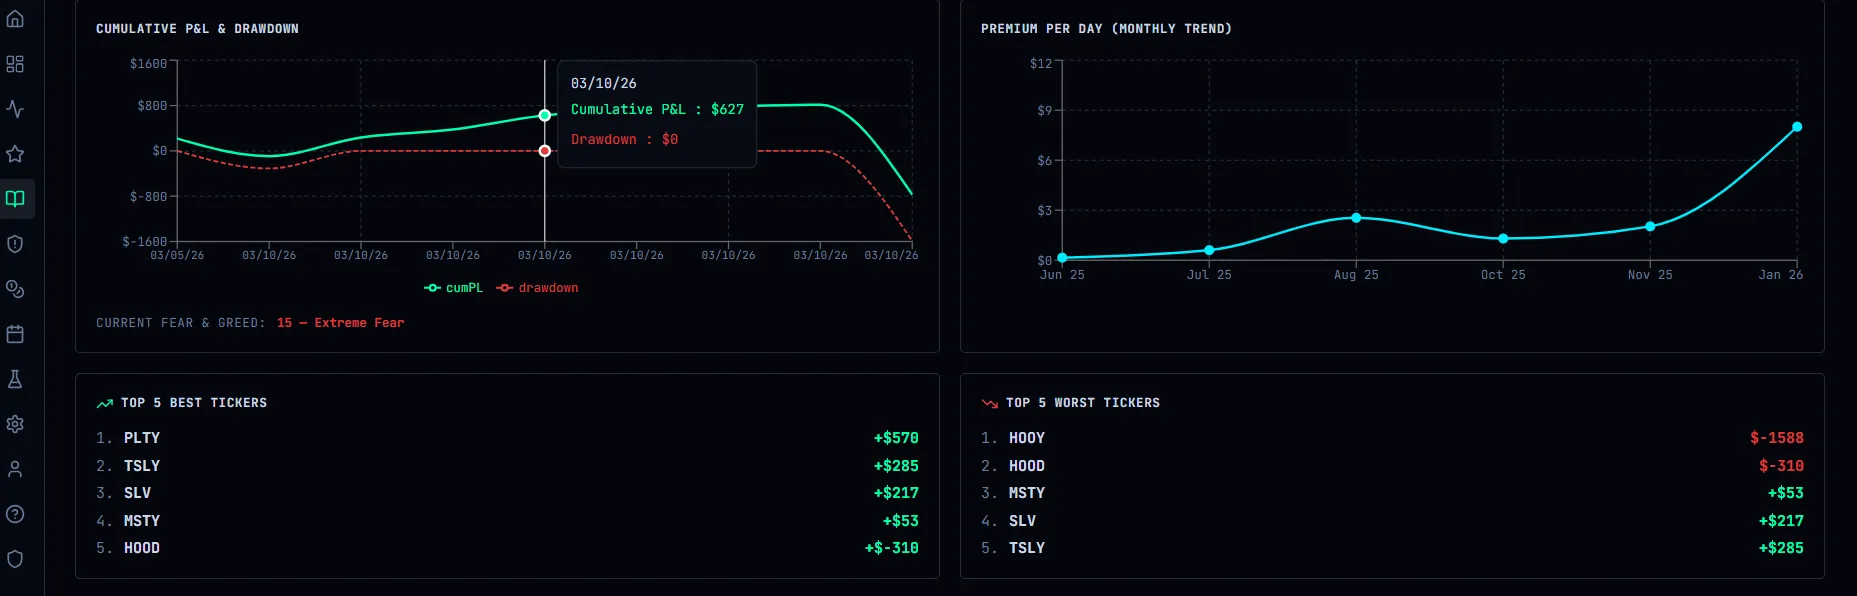
Log every CSP and covered call with full P&L tracking, automated roll scanning, and performance analytics — all in one place.
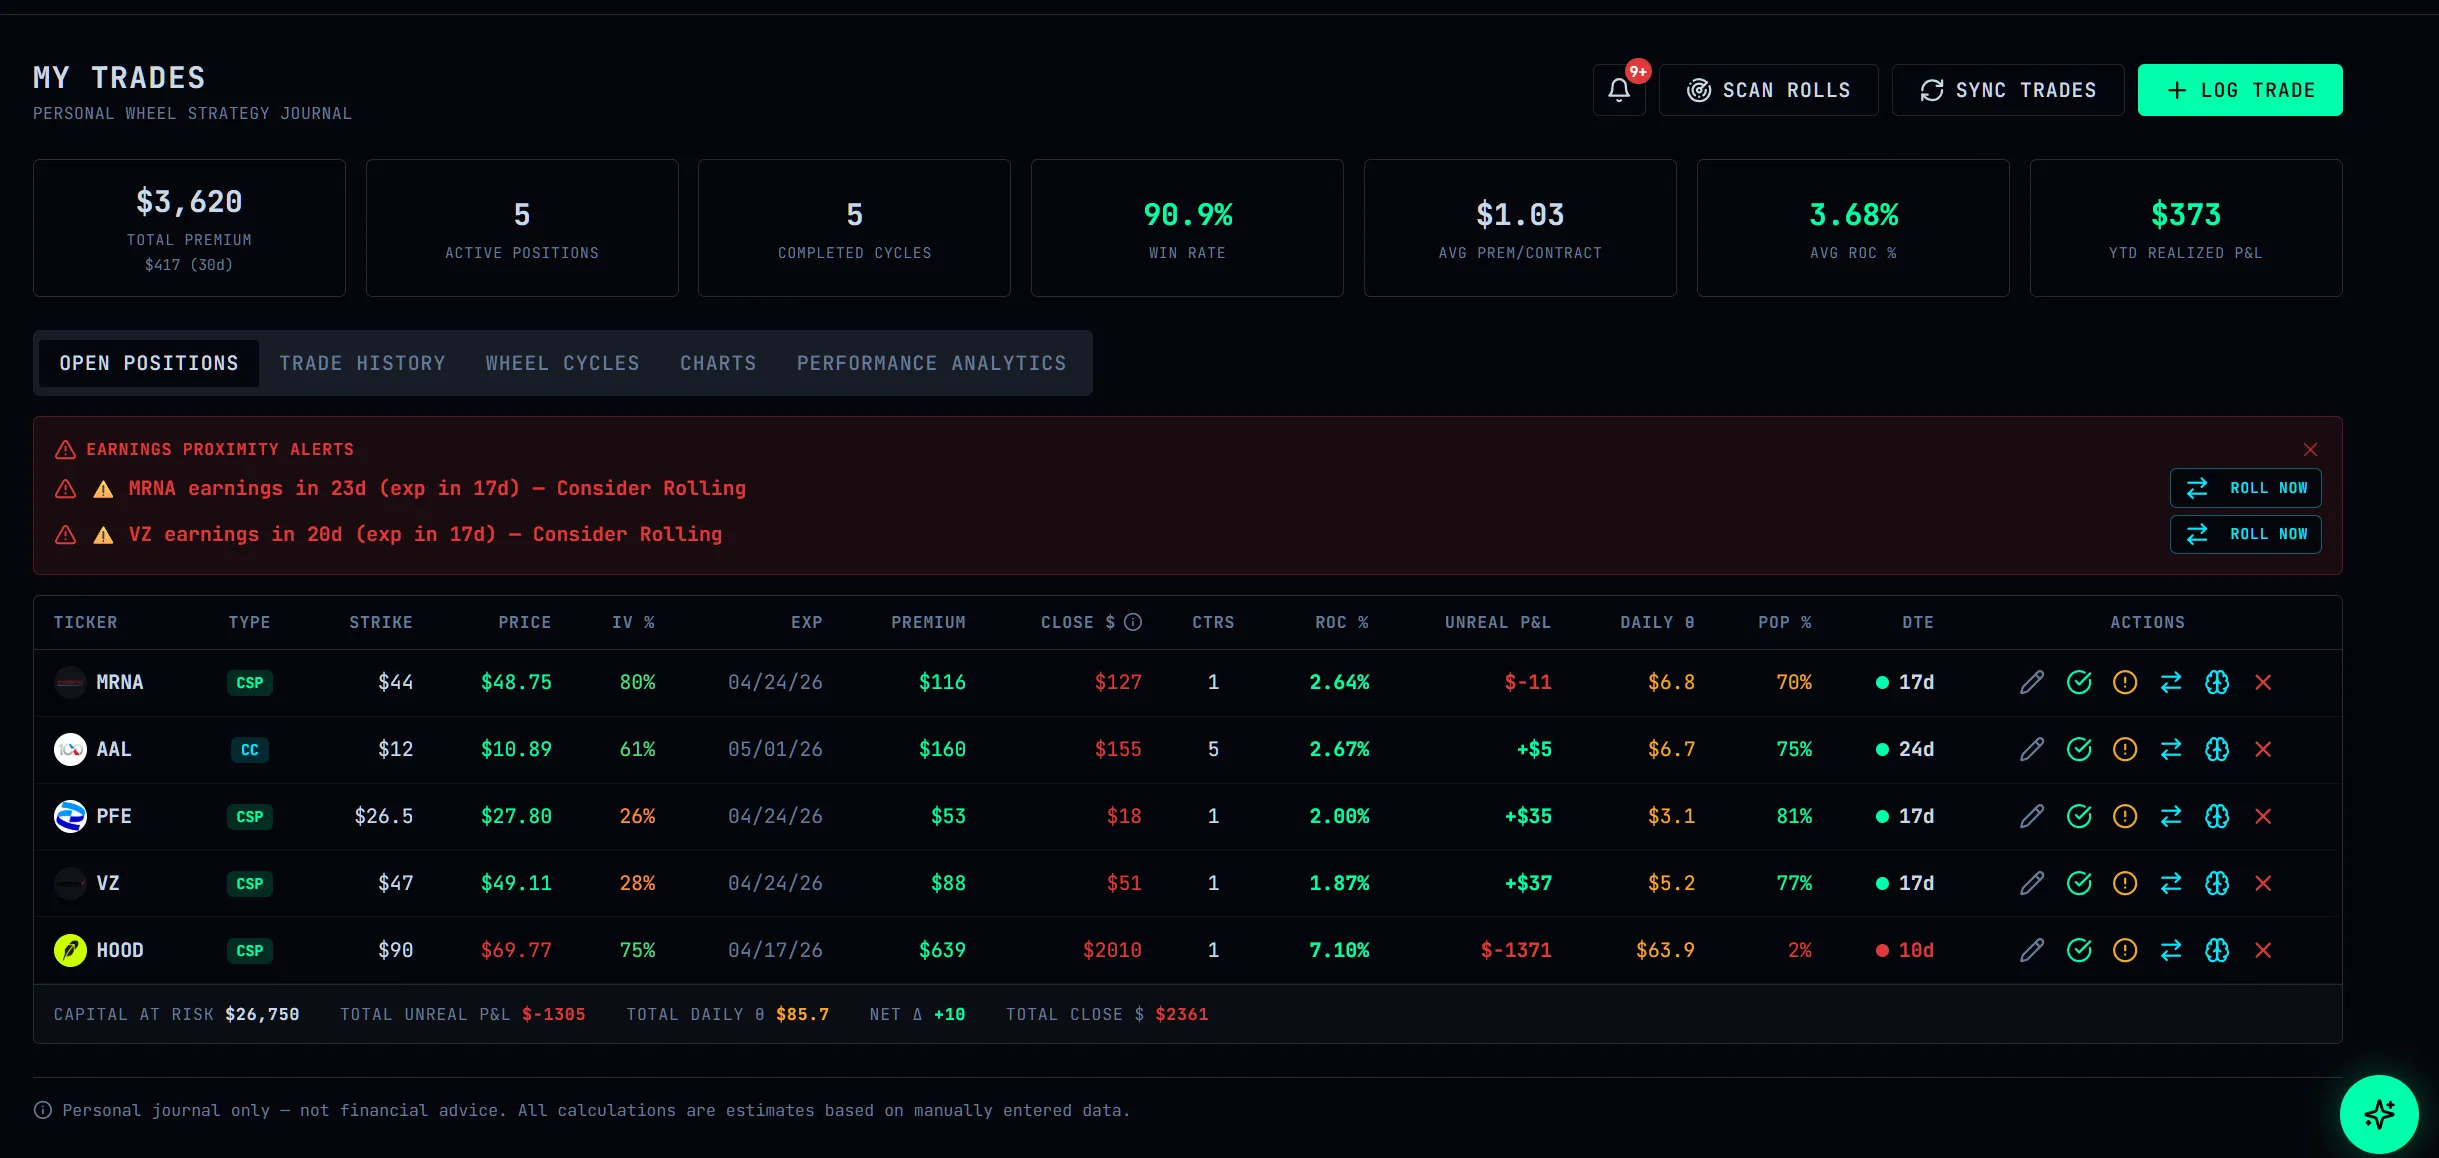
Open Positions Tracker
Real-time IV%, theta decay, close cost, and P&L for every open CSP and covered call.
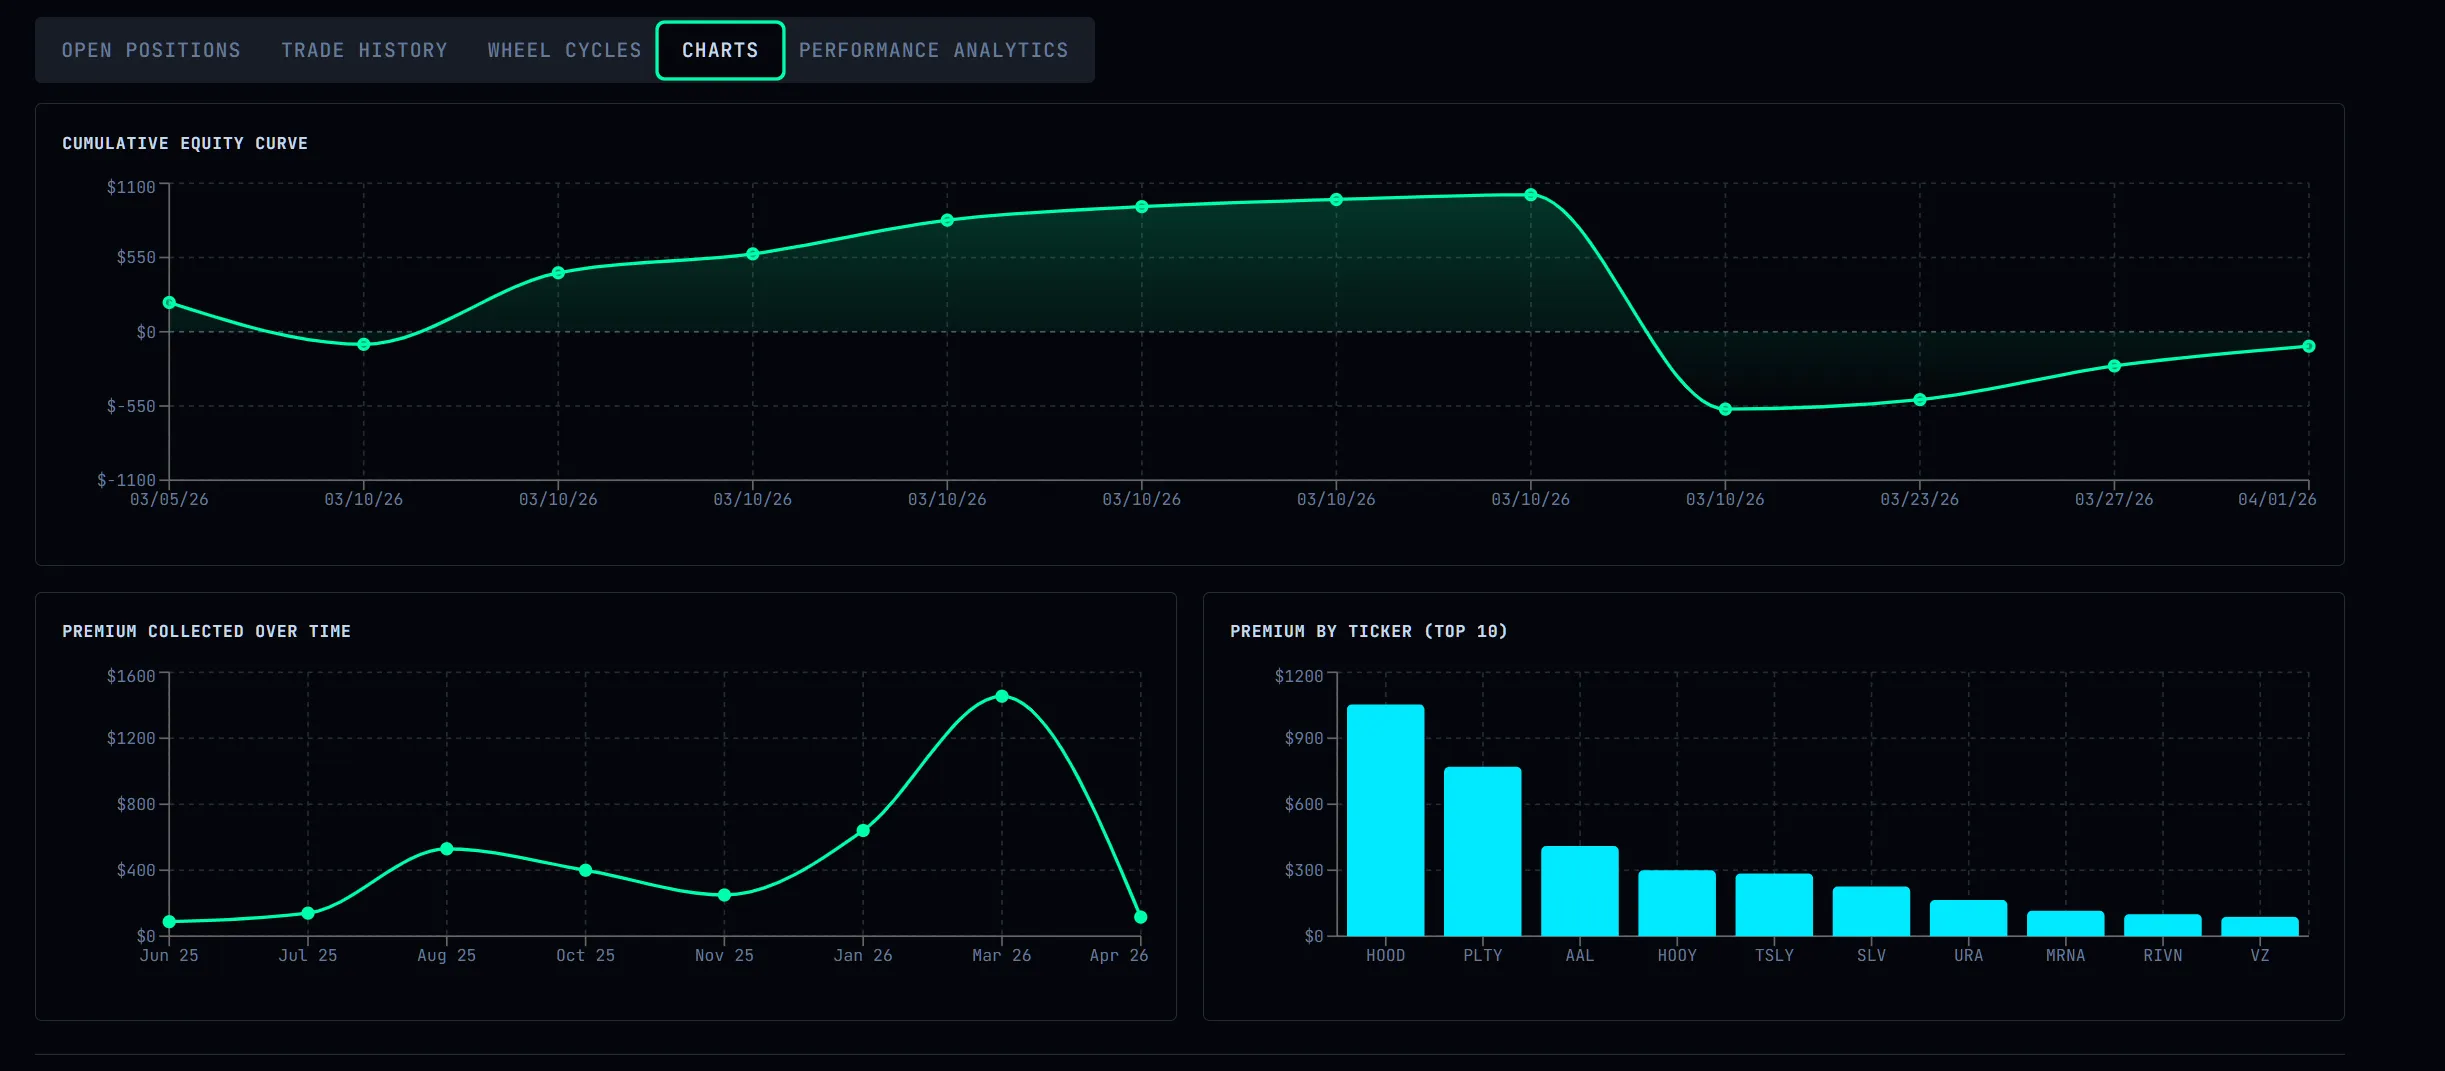
Performance Analytics
Win rates, return on capital, equity curves, and historical performance across all cycles.
Automated Alerts
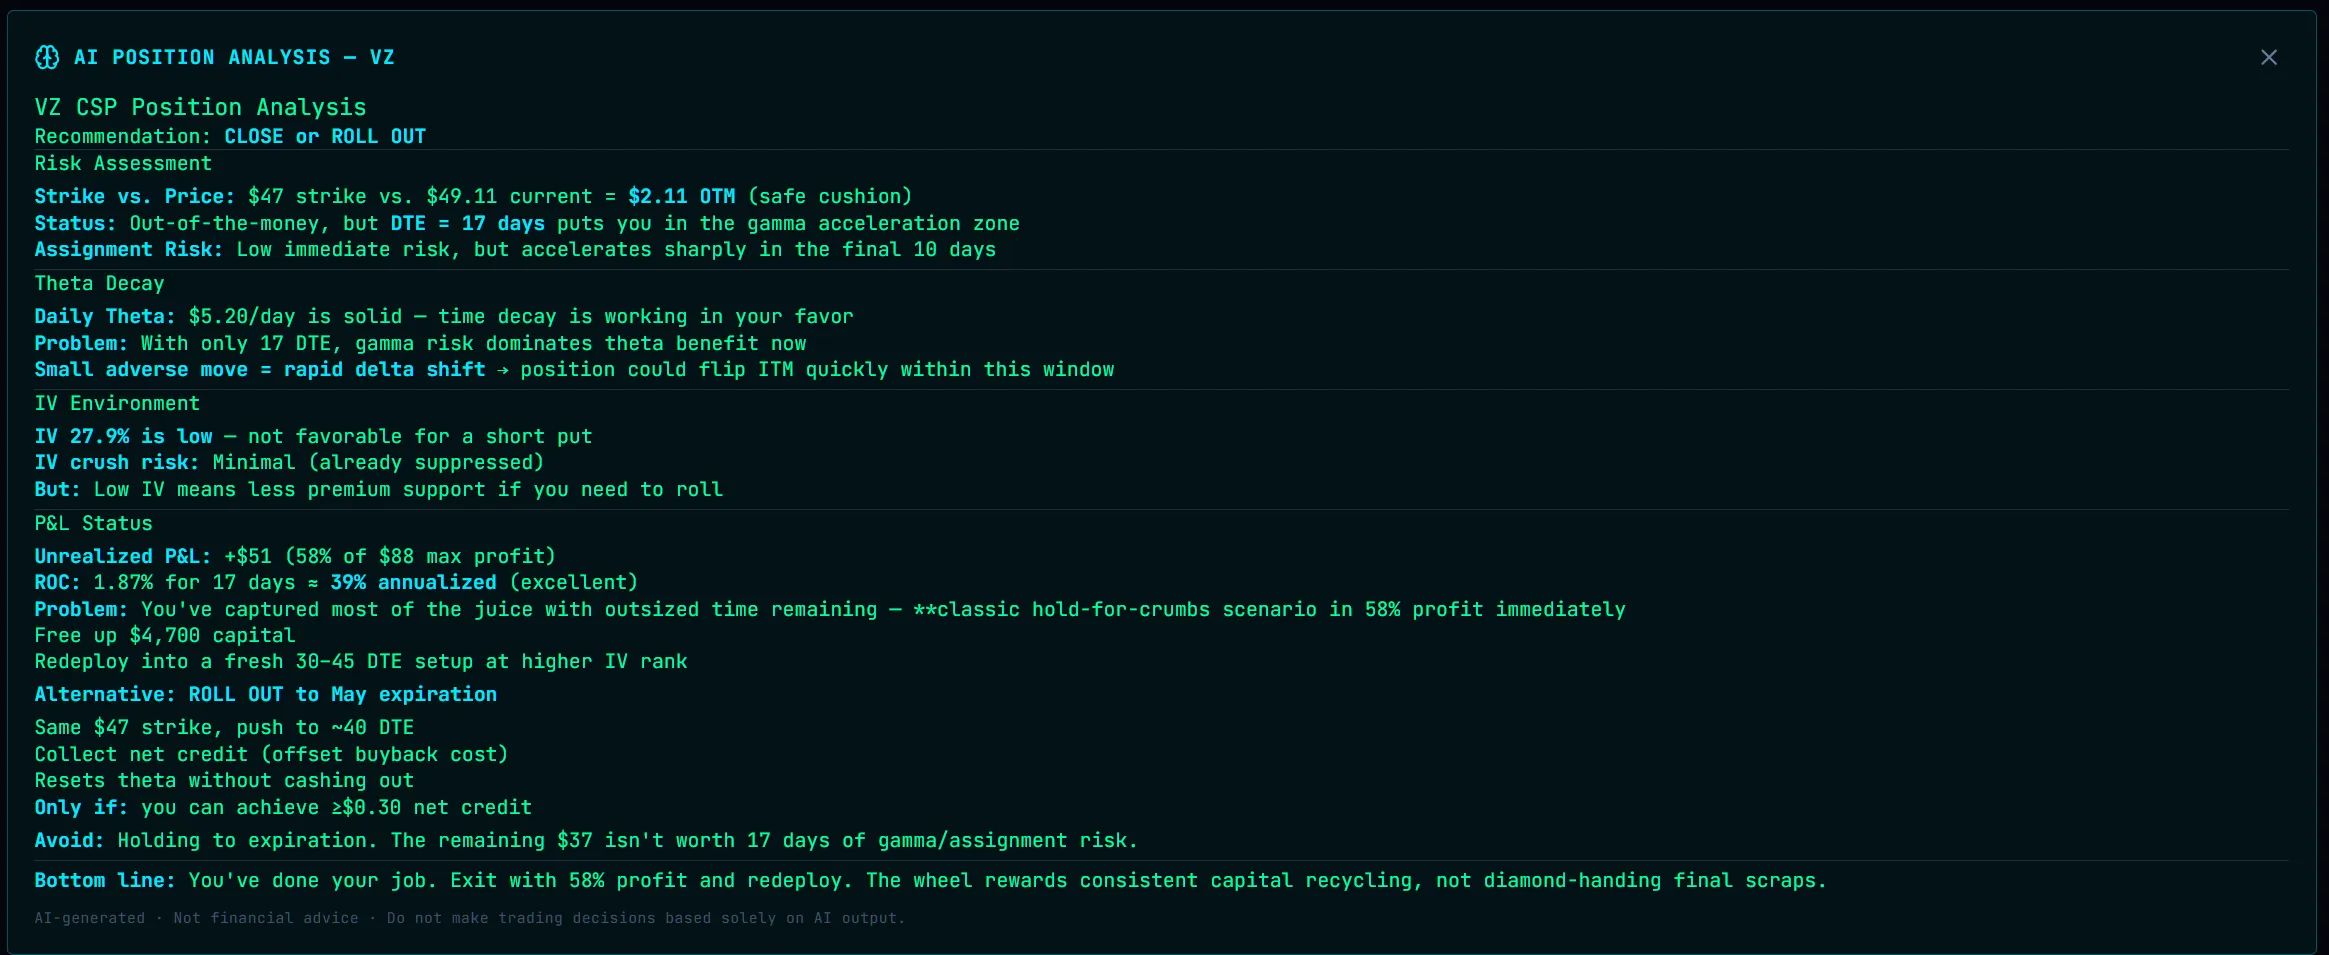
Scan for roll opportunities, get notification center alerts, and AI-powered trade insights.
Know Your Risk. Before It Knows You.
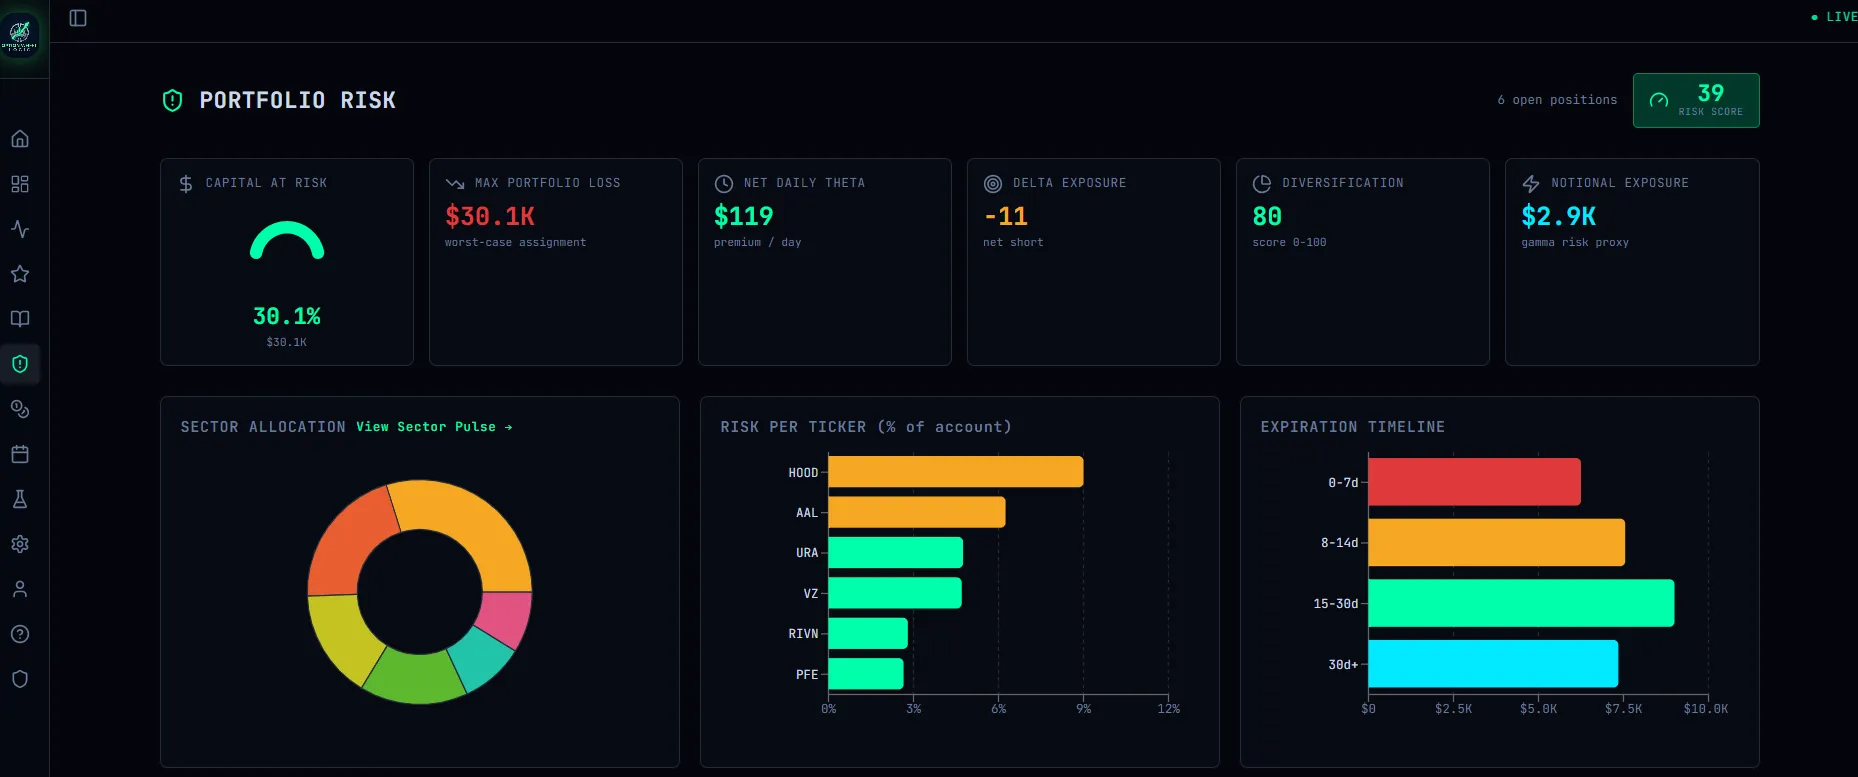
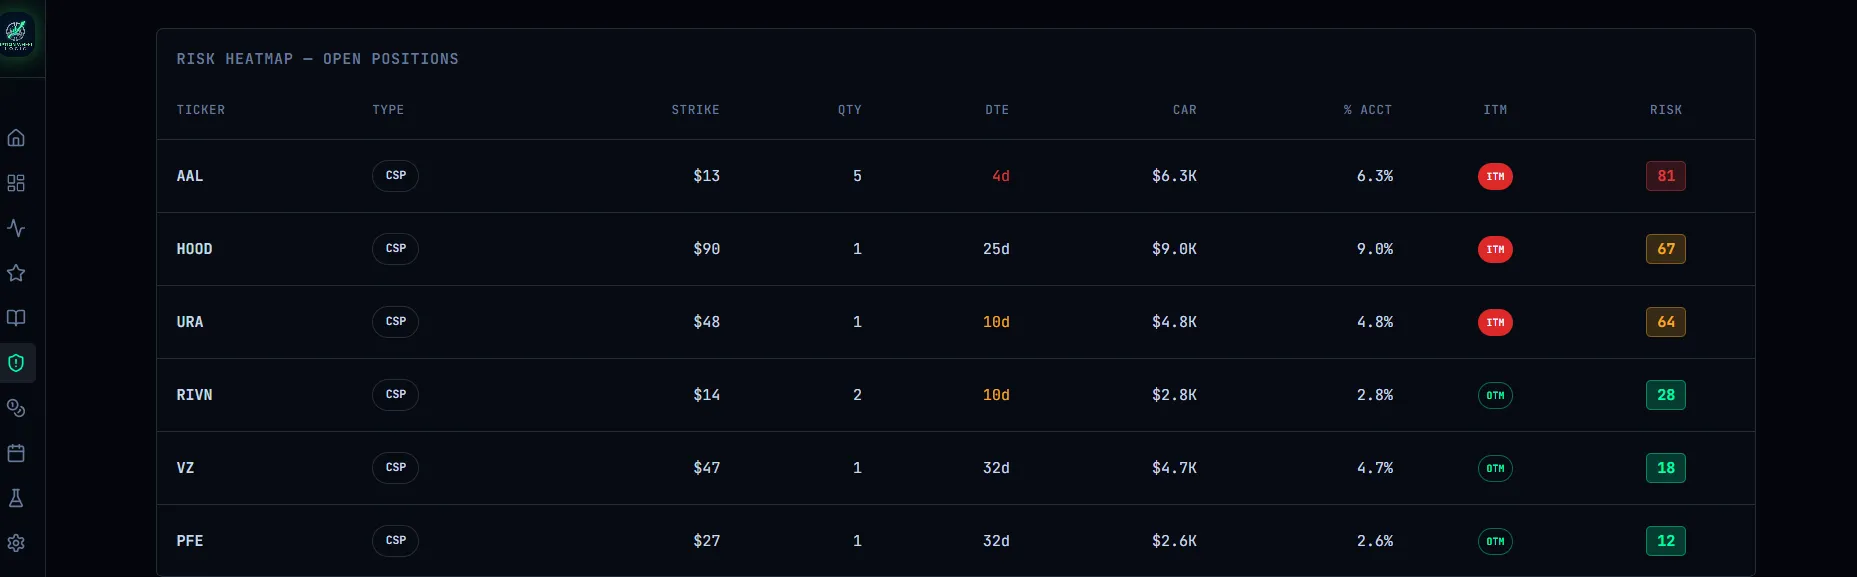
A real-time risk dashboard built for wheel traders — composite scoring, sector concentration, DTE exposure buckets, and AI-powered insights so you always know exactly where you stand.

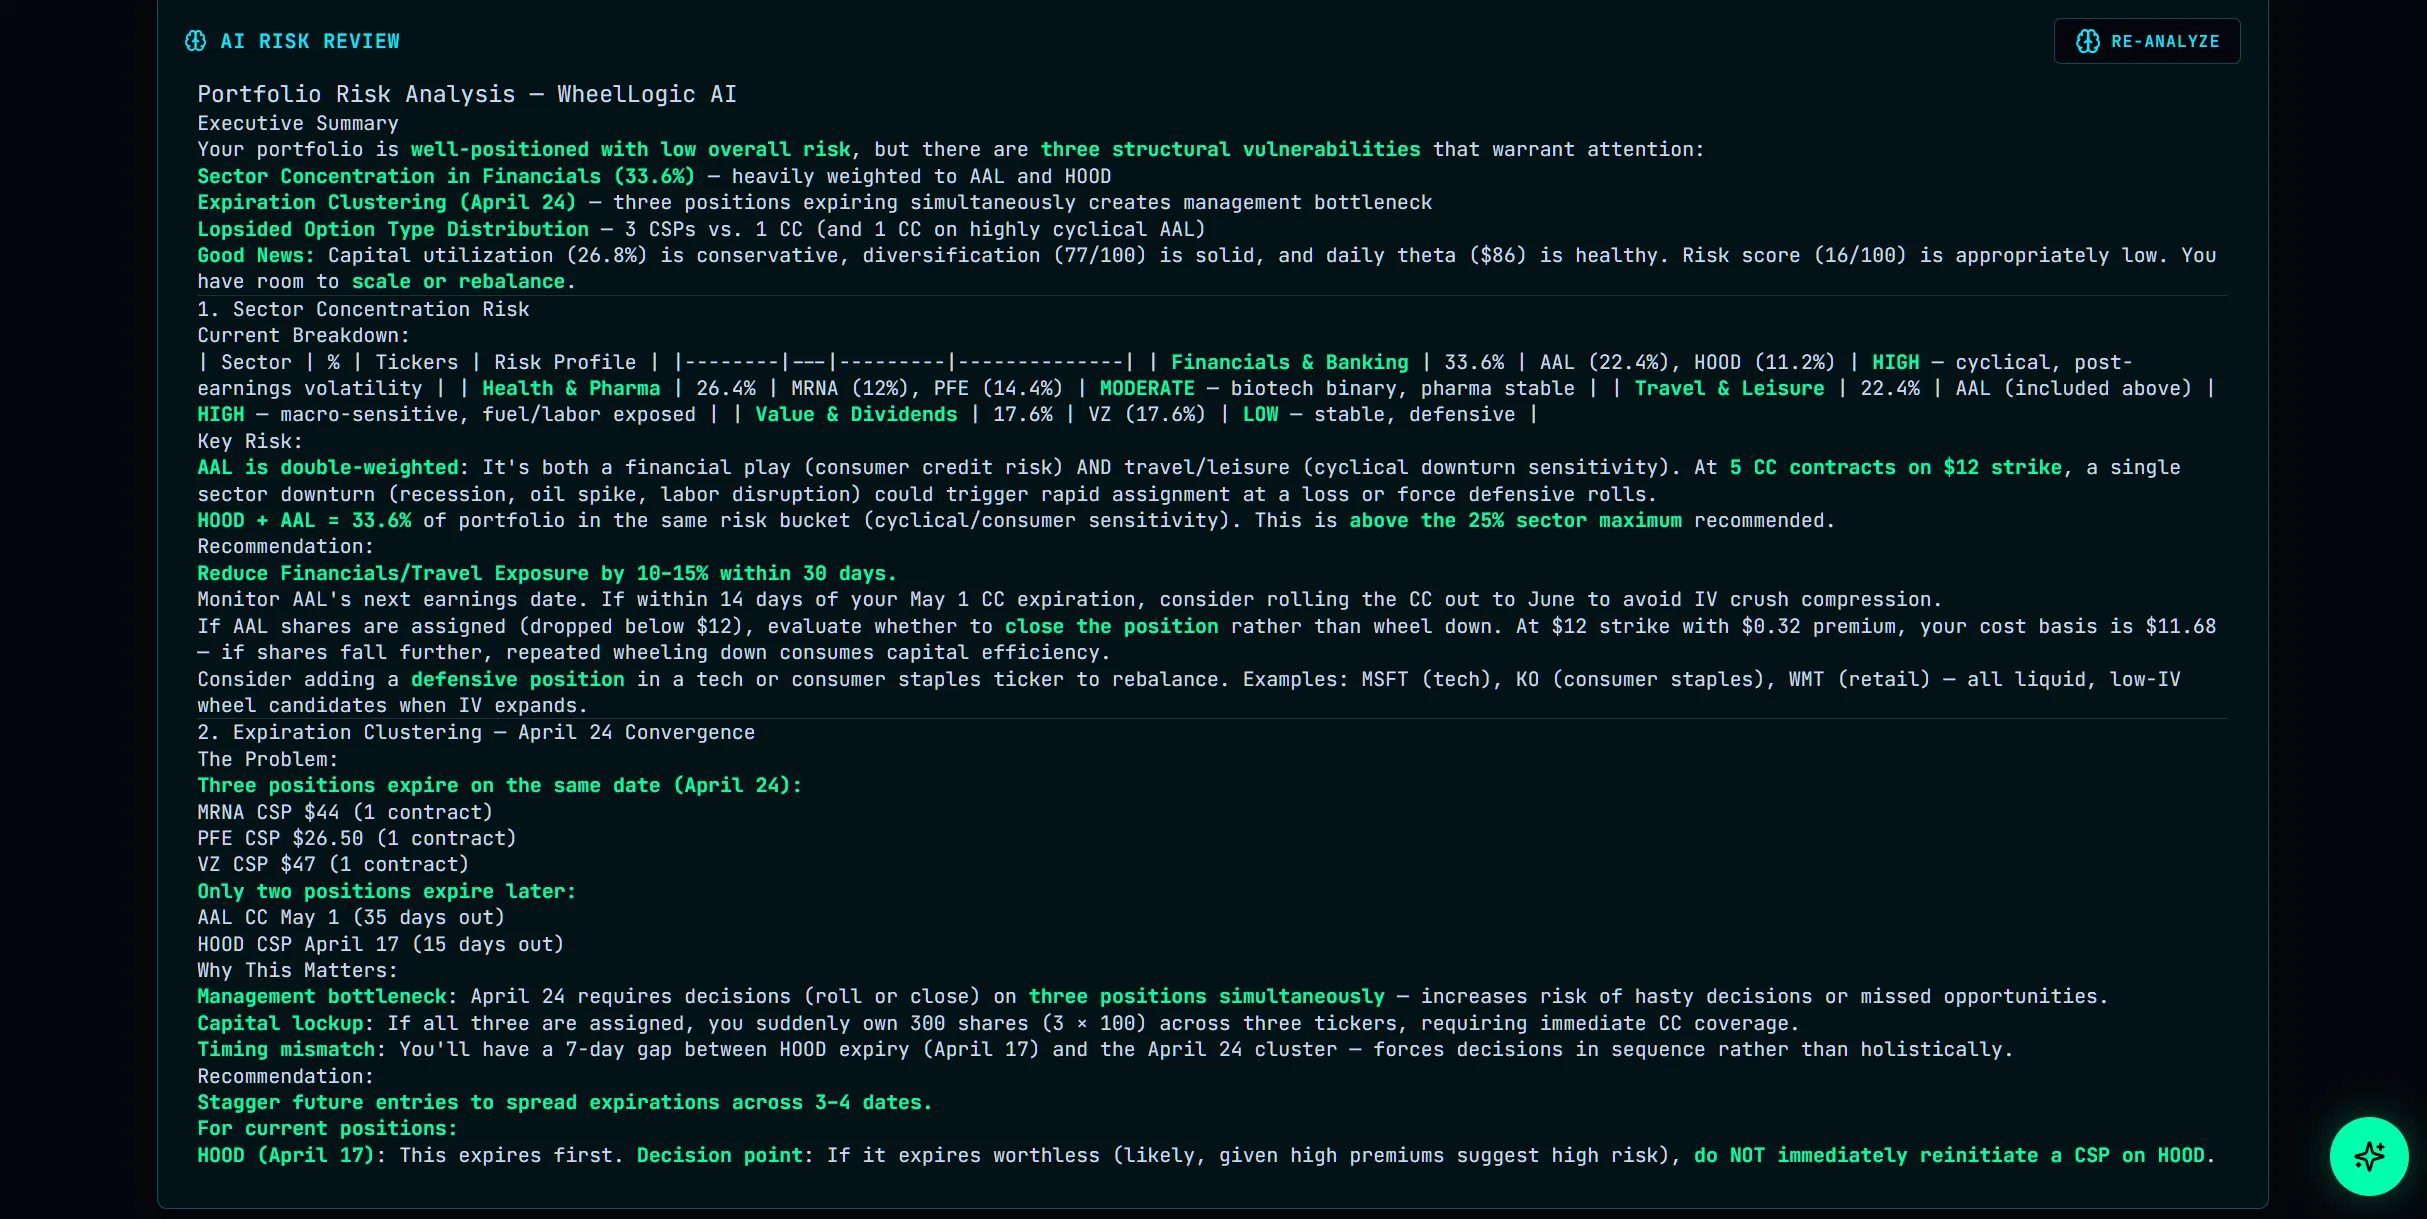
Composite Risk Score
A 0–100 score built from capital utilization, ticker concentration, near-expiry exposure, and margin usage — color-coded red, amber, or green at a glance.
Sector Concentration
HHI-based diversification analysis across 18 sectors. See where you're overexposed before it becomes a problem.
Exposure by DTE
Capital expiring in the next 7, 14, and 30 days visualized in one view. Never get caught with too much theta risk at once.
AI Risk Insights
AI analyzes your live portfolio and surfaces concentration warnings, roll candidates, and position sizing suggestions. WheelLogic AI reads your live risk data on this page — ask it questions directly.
Sector Pulse. Track Market Momentum.
Visualize sector rotation, breadth, and momentum trends to time your entries with confidence.
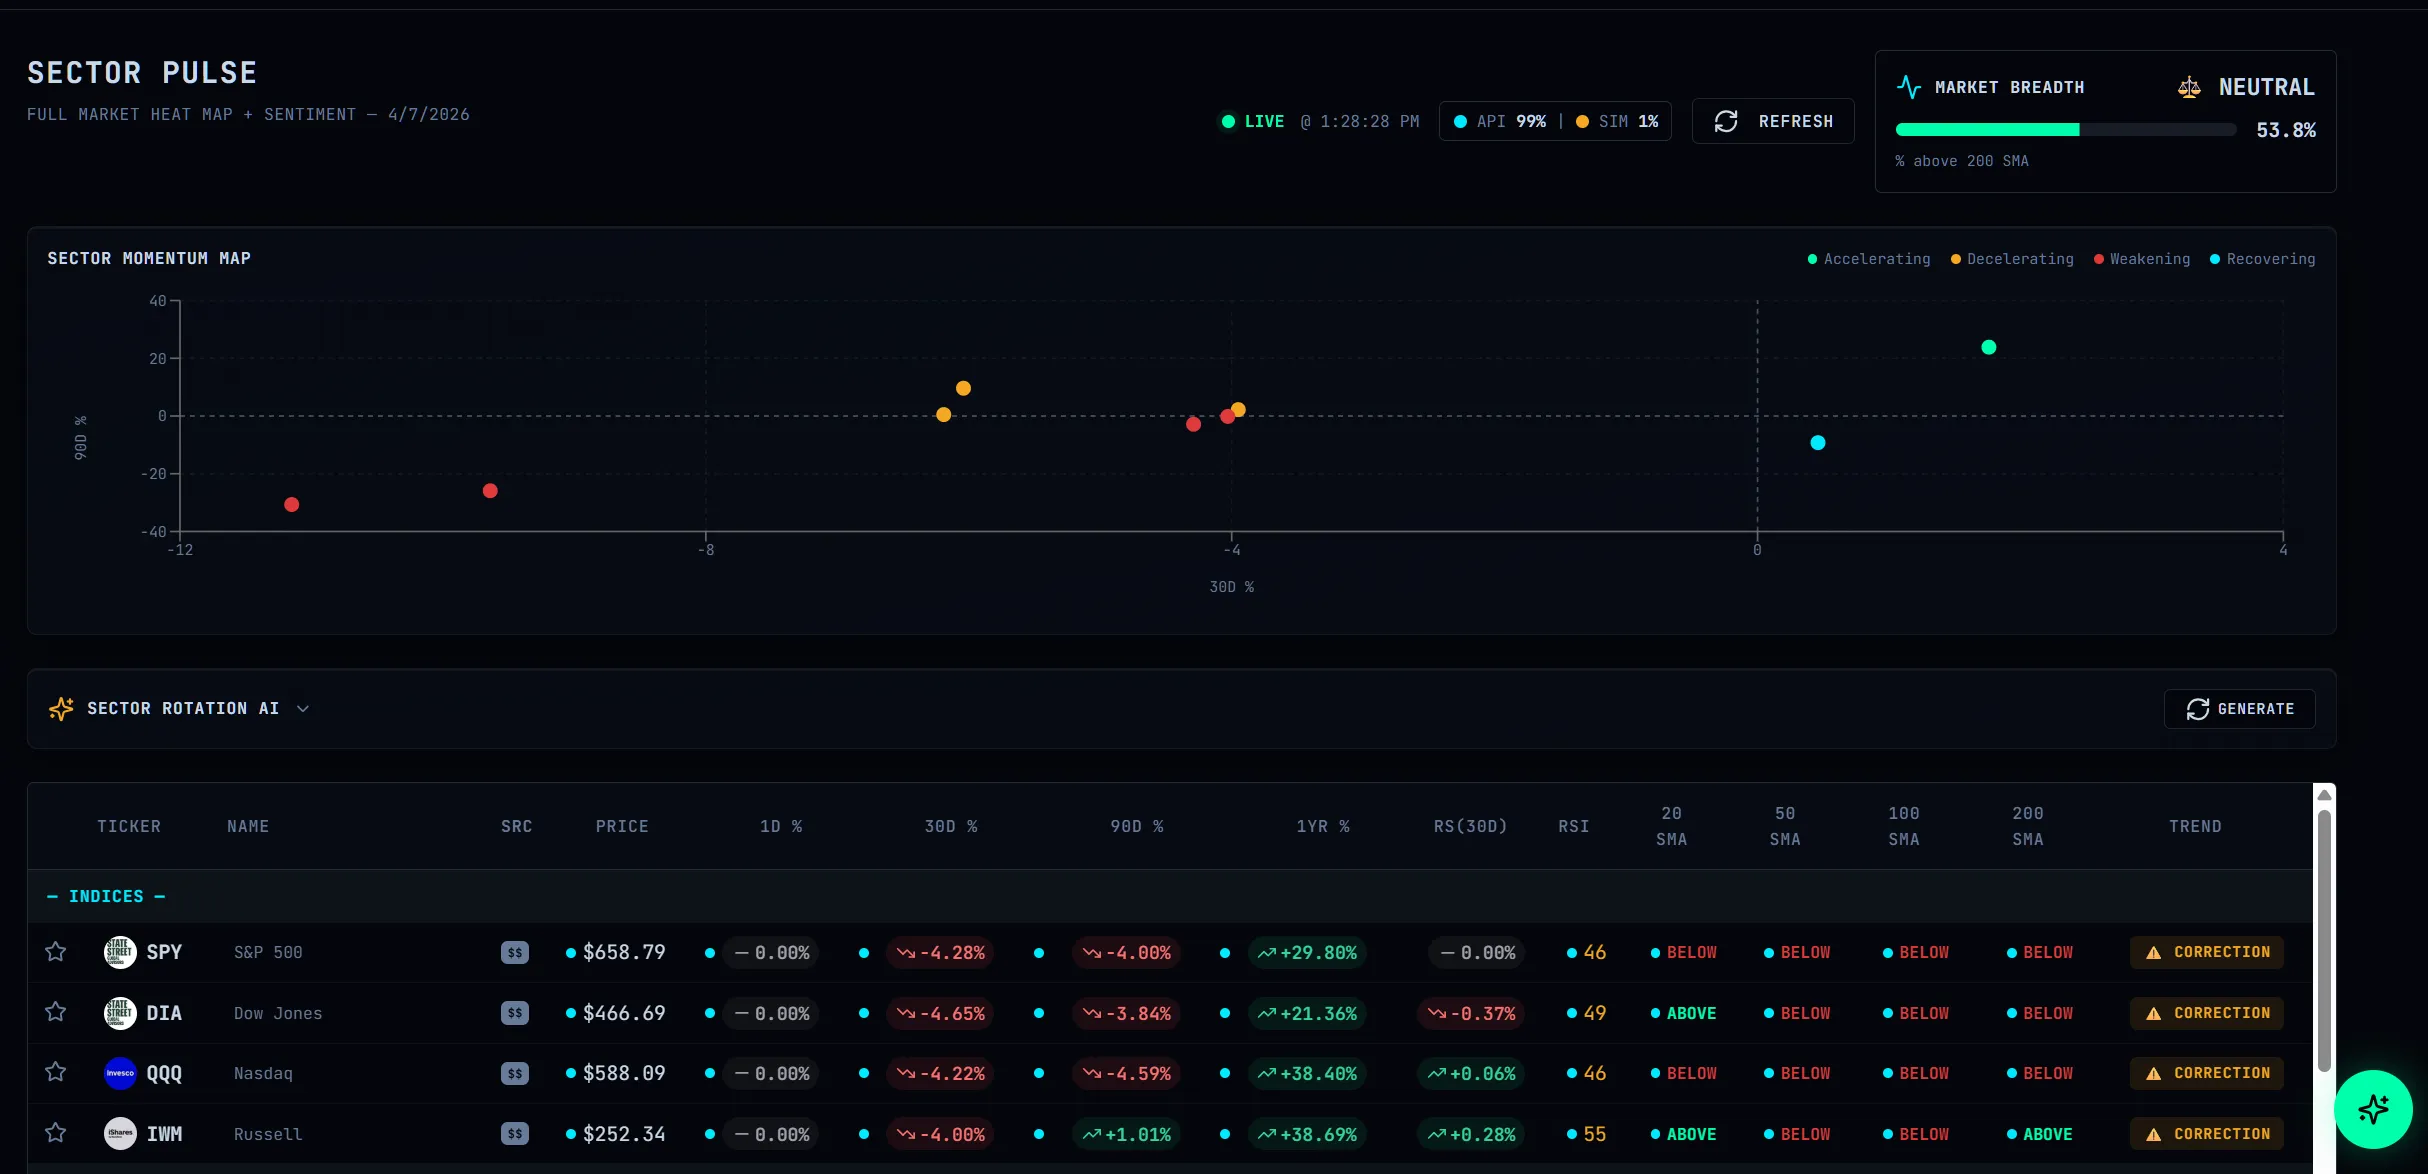
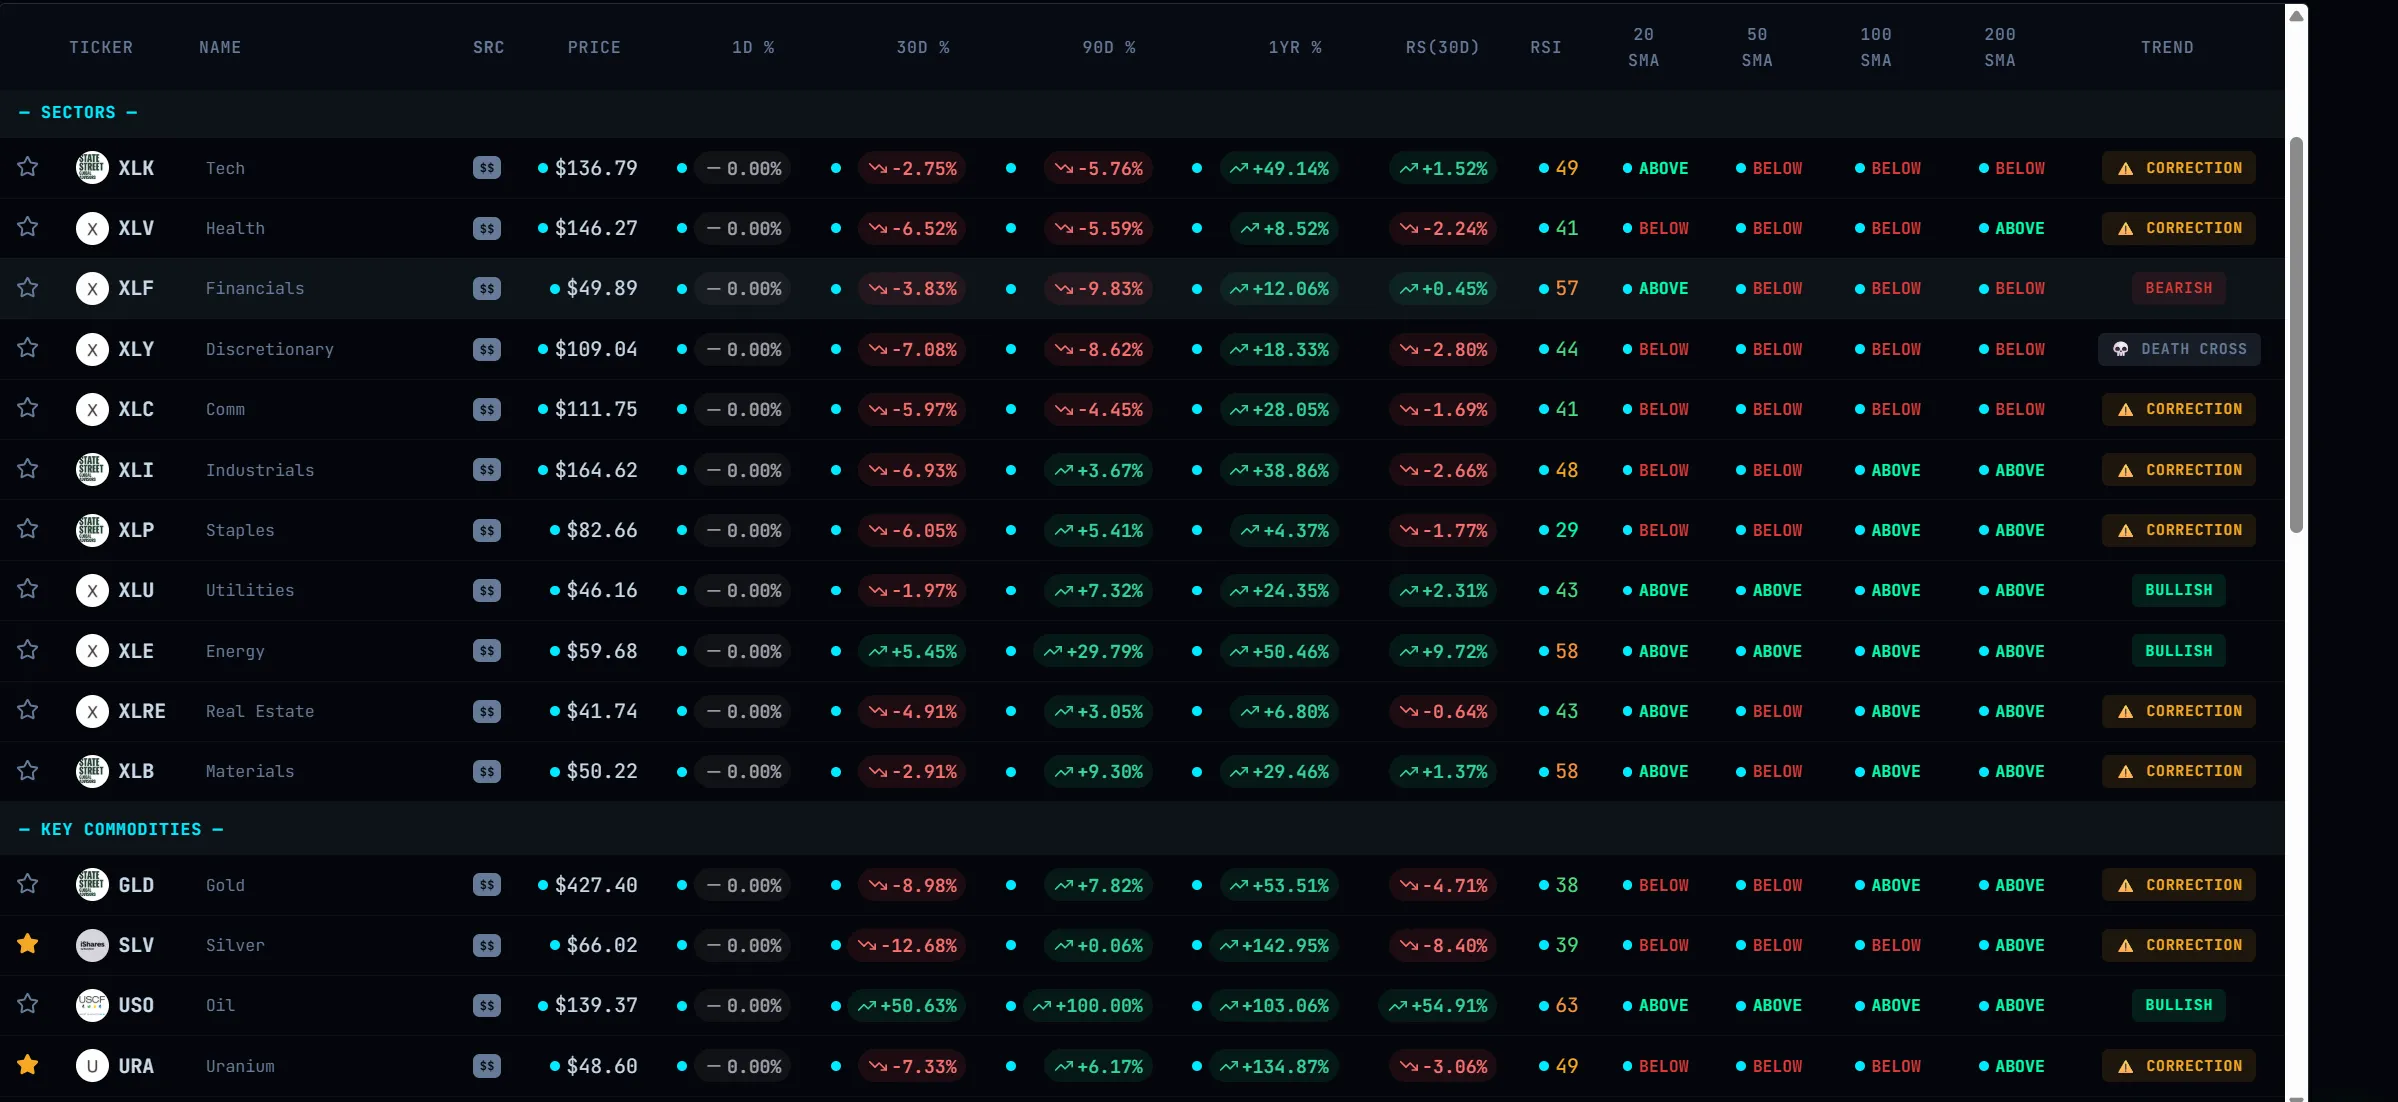
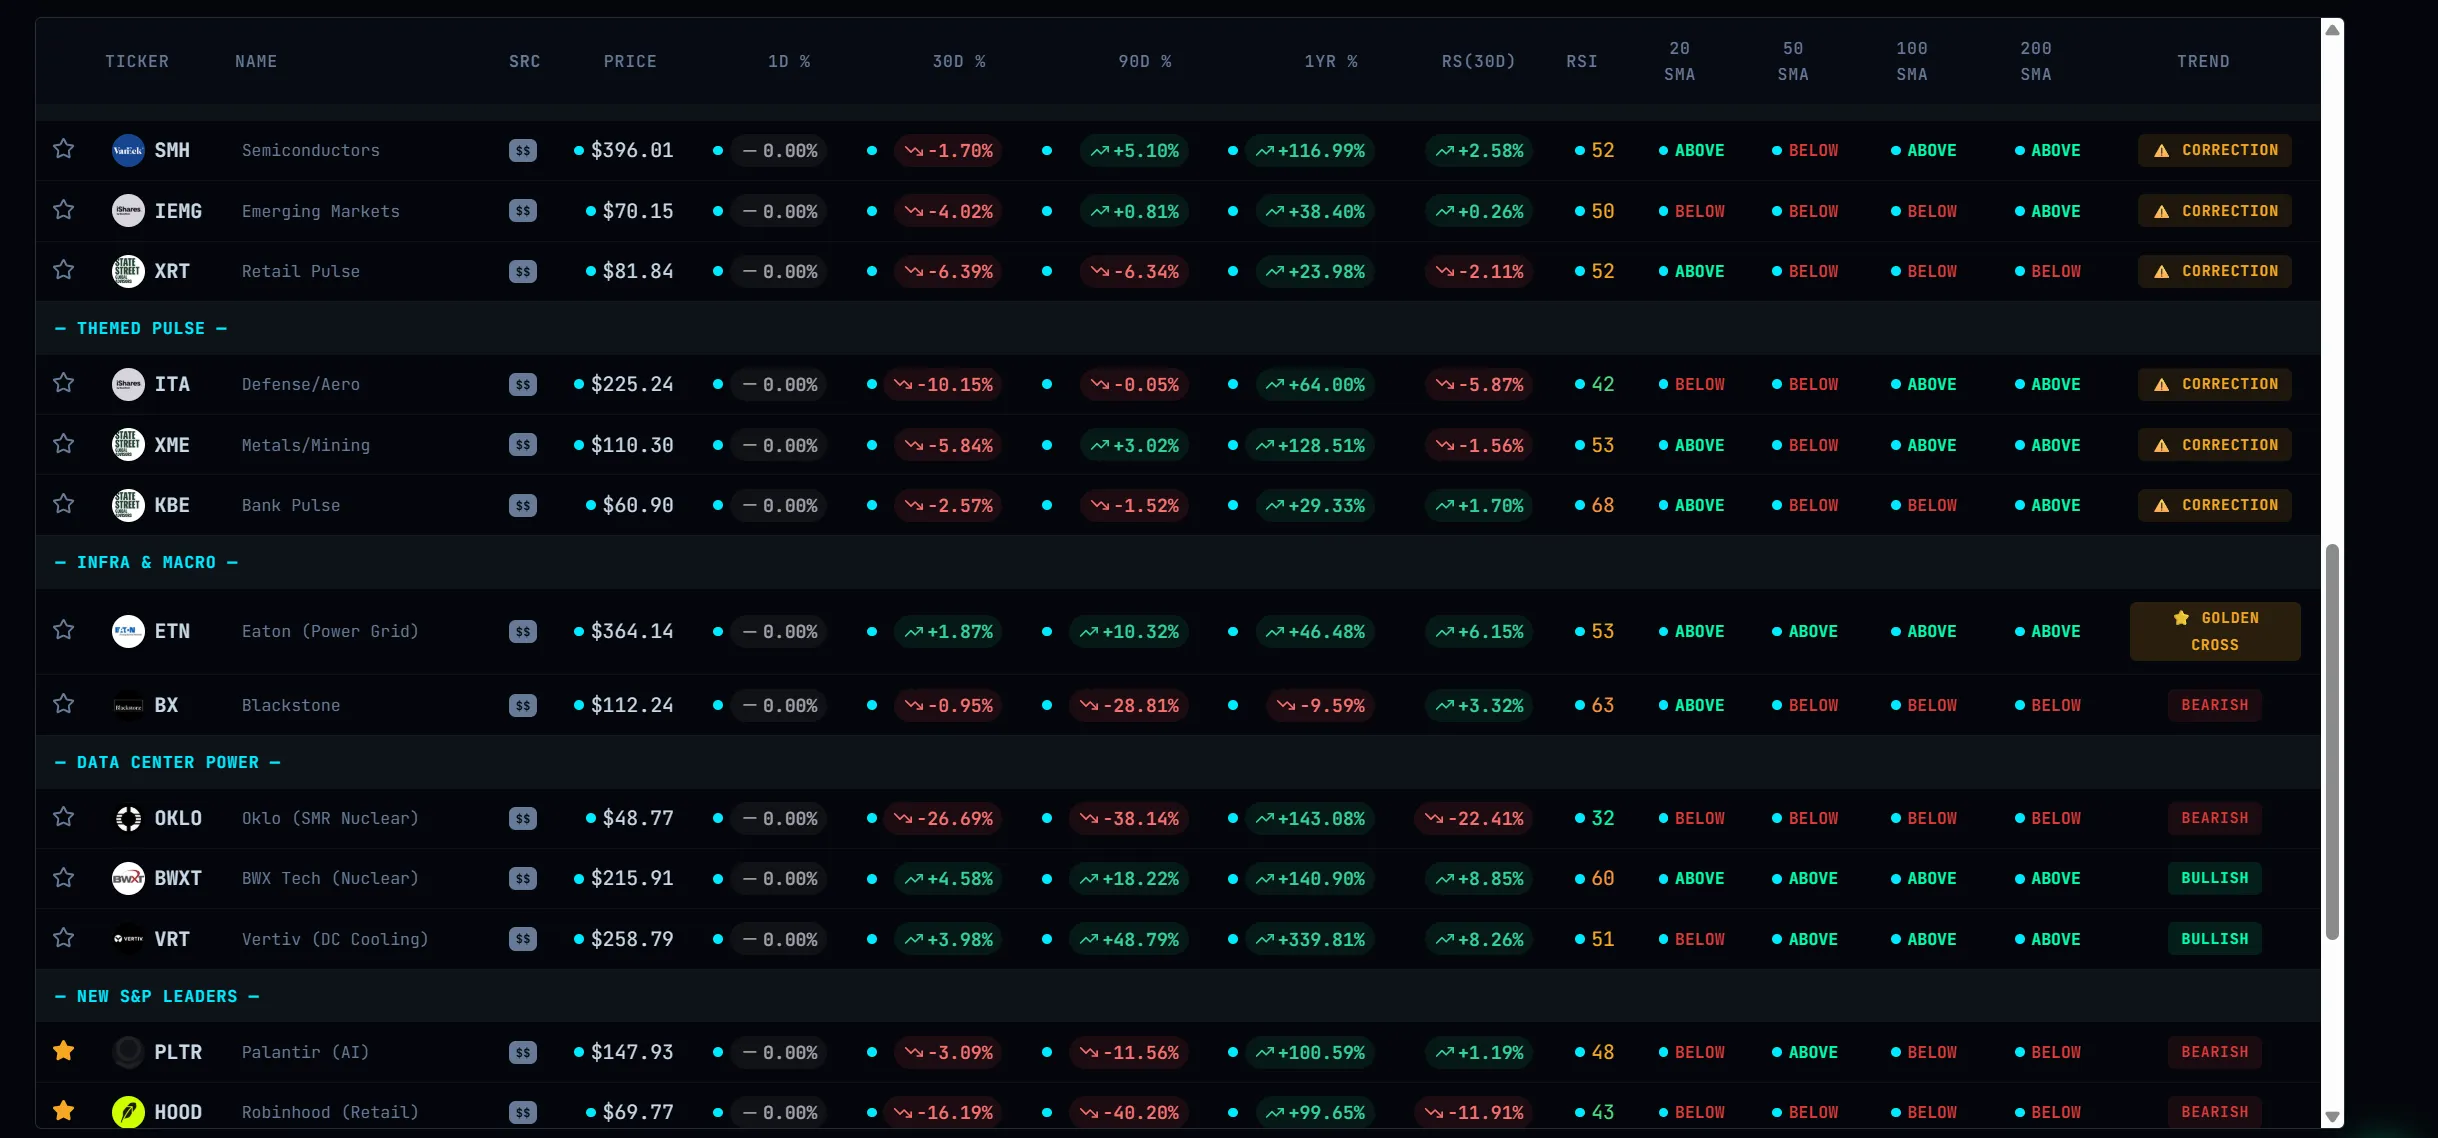

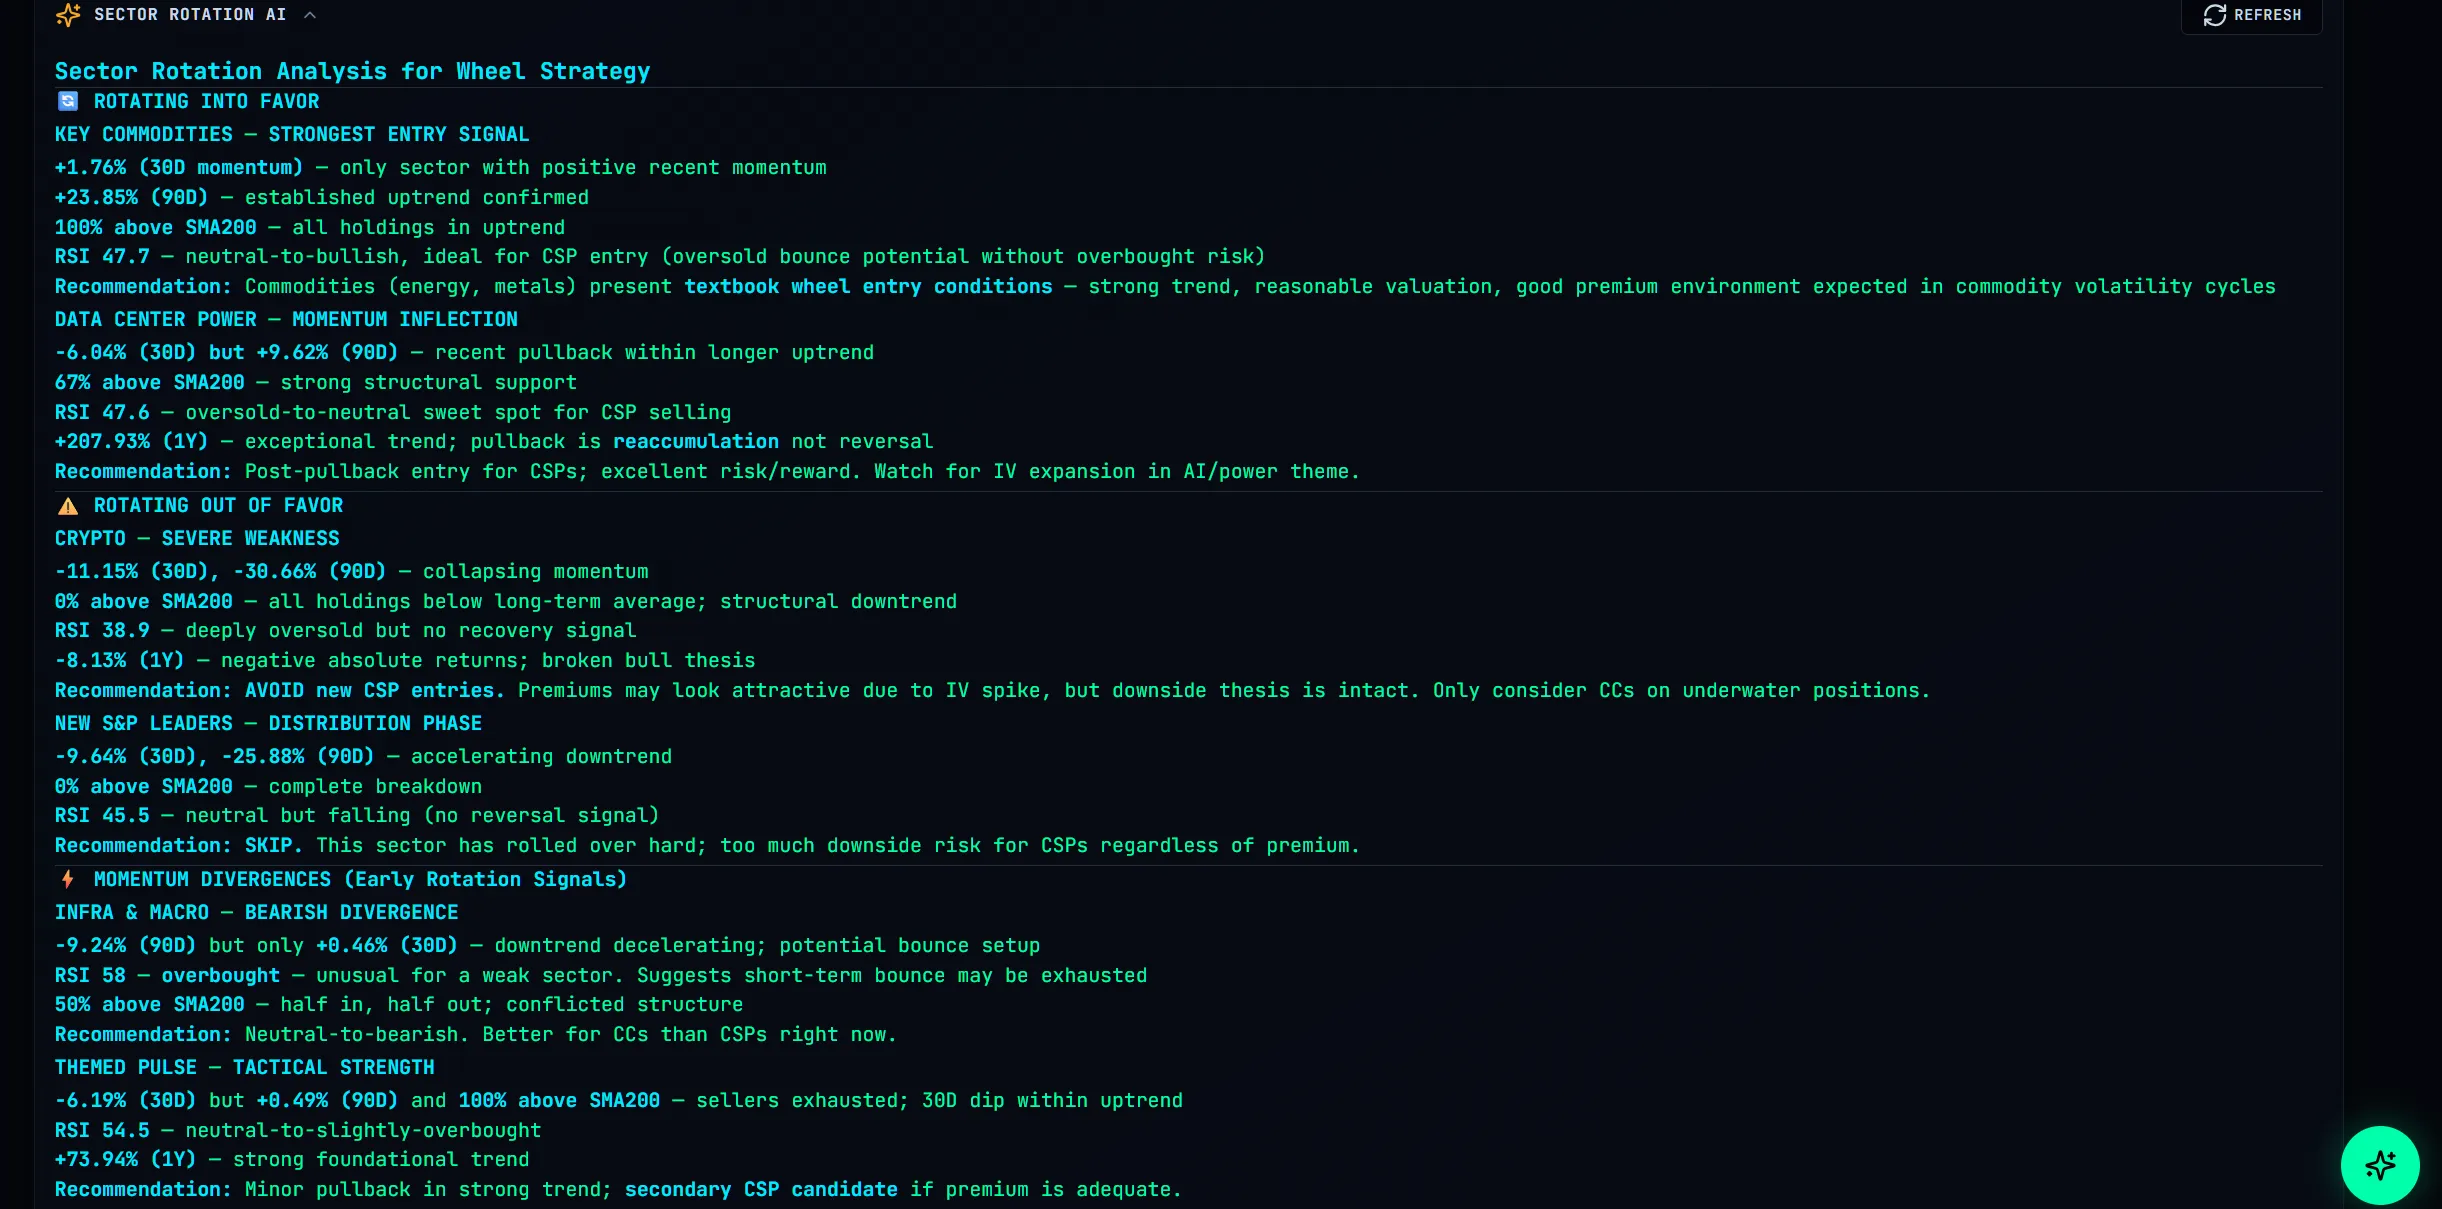
Momentum Map
Heat-mapped sector performance across multiple timeframes — spot rotation before it happens.
Breadth Gauge
See how many stocks in each sector are above key moving averages for true market health.
Trend Detection
Algorithmic trend scoring identifies sectors gaining or losing momentum in real time.