We use cookies to improve your experience and analyze site usage. Privacy Policy
Feature Showcases
See exactly how each tool looks and works inside WheelLogic — from deep-dive charts to real-time screeners and sector intelligence.
Your Live Market Command Center
From the moment you open the app, your dashboard is alive with real-time market data, sentiment, and AI-curated intelligence.
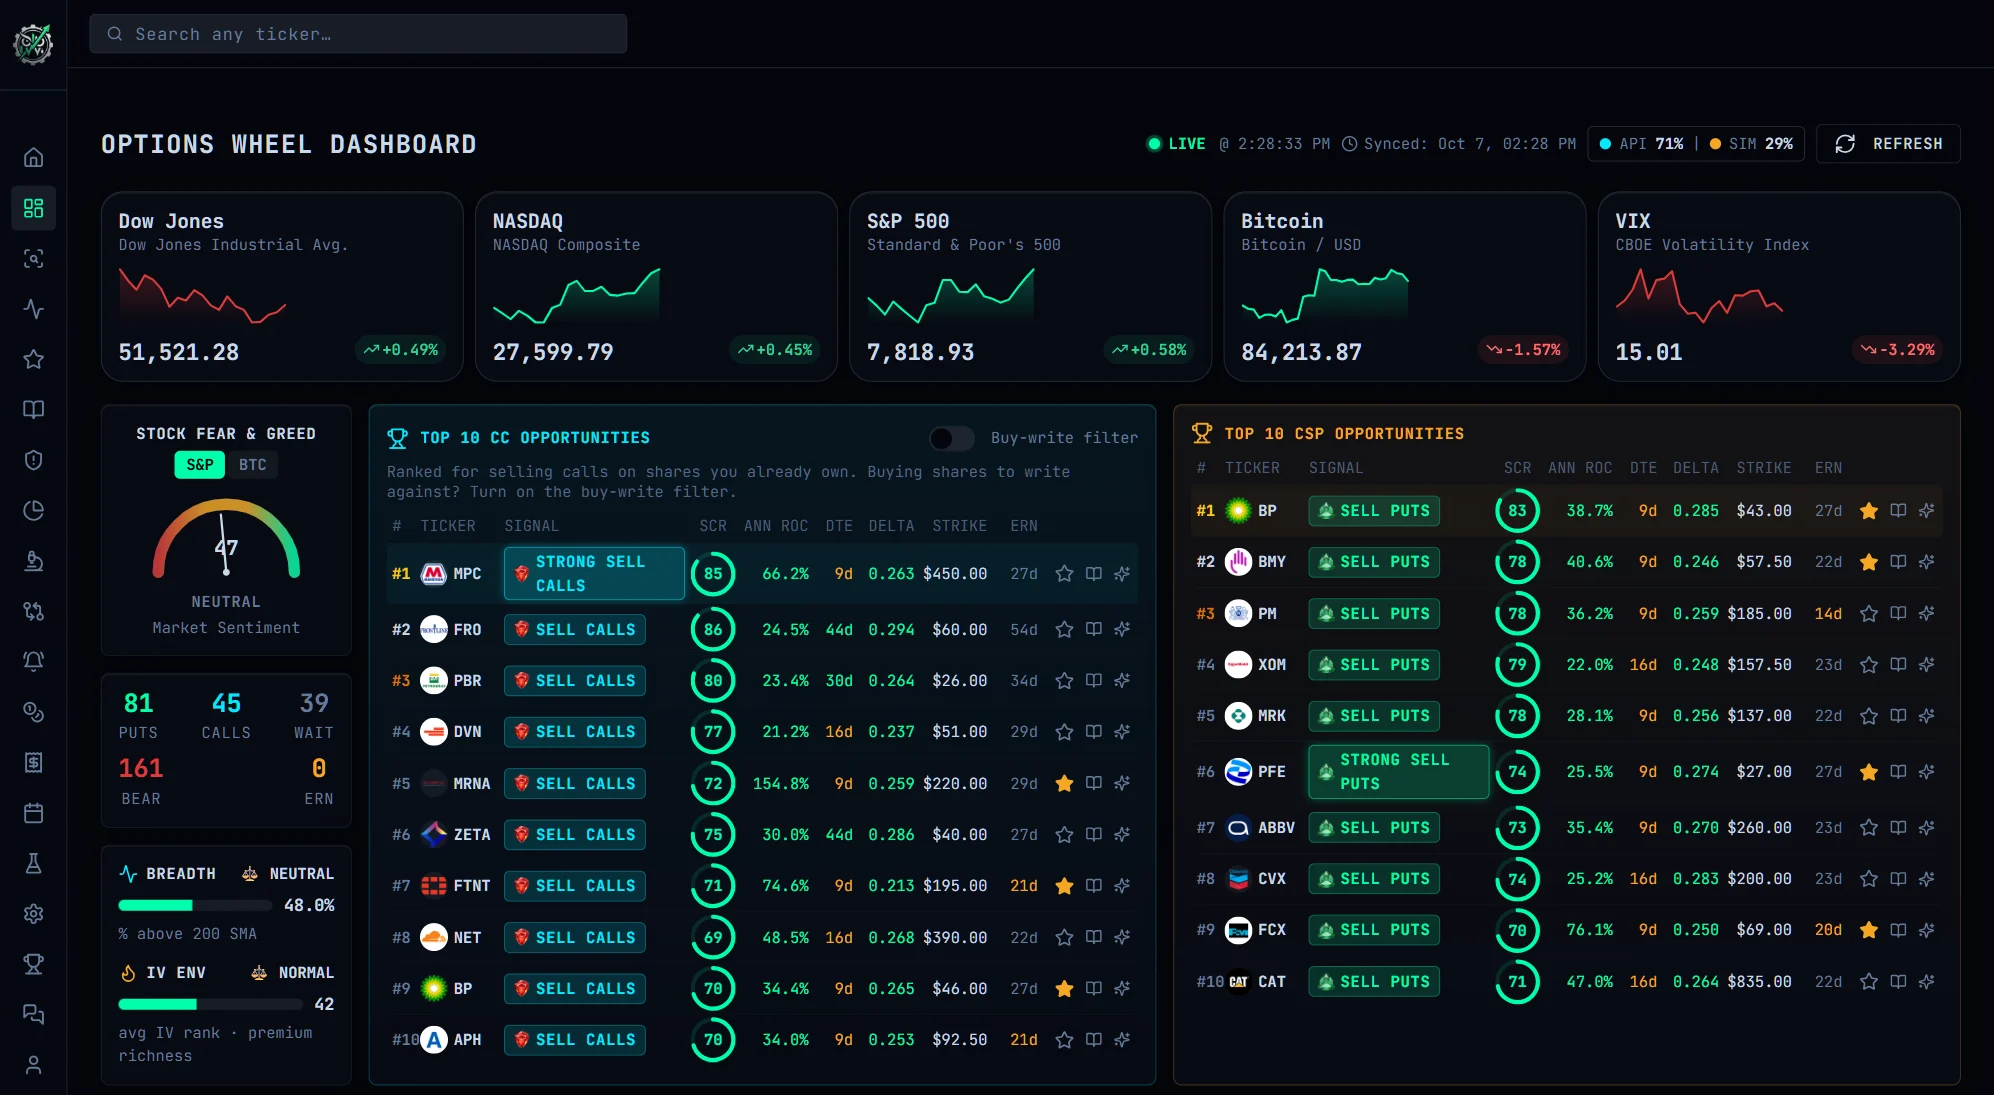
Fear & Greed Gauges
Dual stock and crypto sentiment gauges updated live — know whether the market is fearful or euphoric before placing a trade.
Live Market Indices
DJI, IXIC, GSPC, and VIX displayed with 30-day sparklines — instant pulse on macro market direction.
Weekly Market Digest
AI-generated weekly summary of top wheel candidates, sector rotation signals, and market breadth interpretation.
Top 10 CSP & CC Opportunities
Daily-ranked lists of the best cash-secured puts and covered calls — sorted by composite score, IV rank, and premium yield.
Real-Time Screener. Score Every Ticker.
300+ tickers scored across 10+ factors — IV, delta, RSI, beta, earnings proximity, and more. Updated in real time.
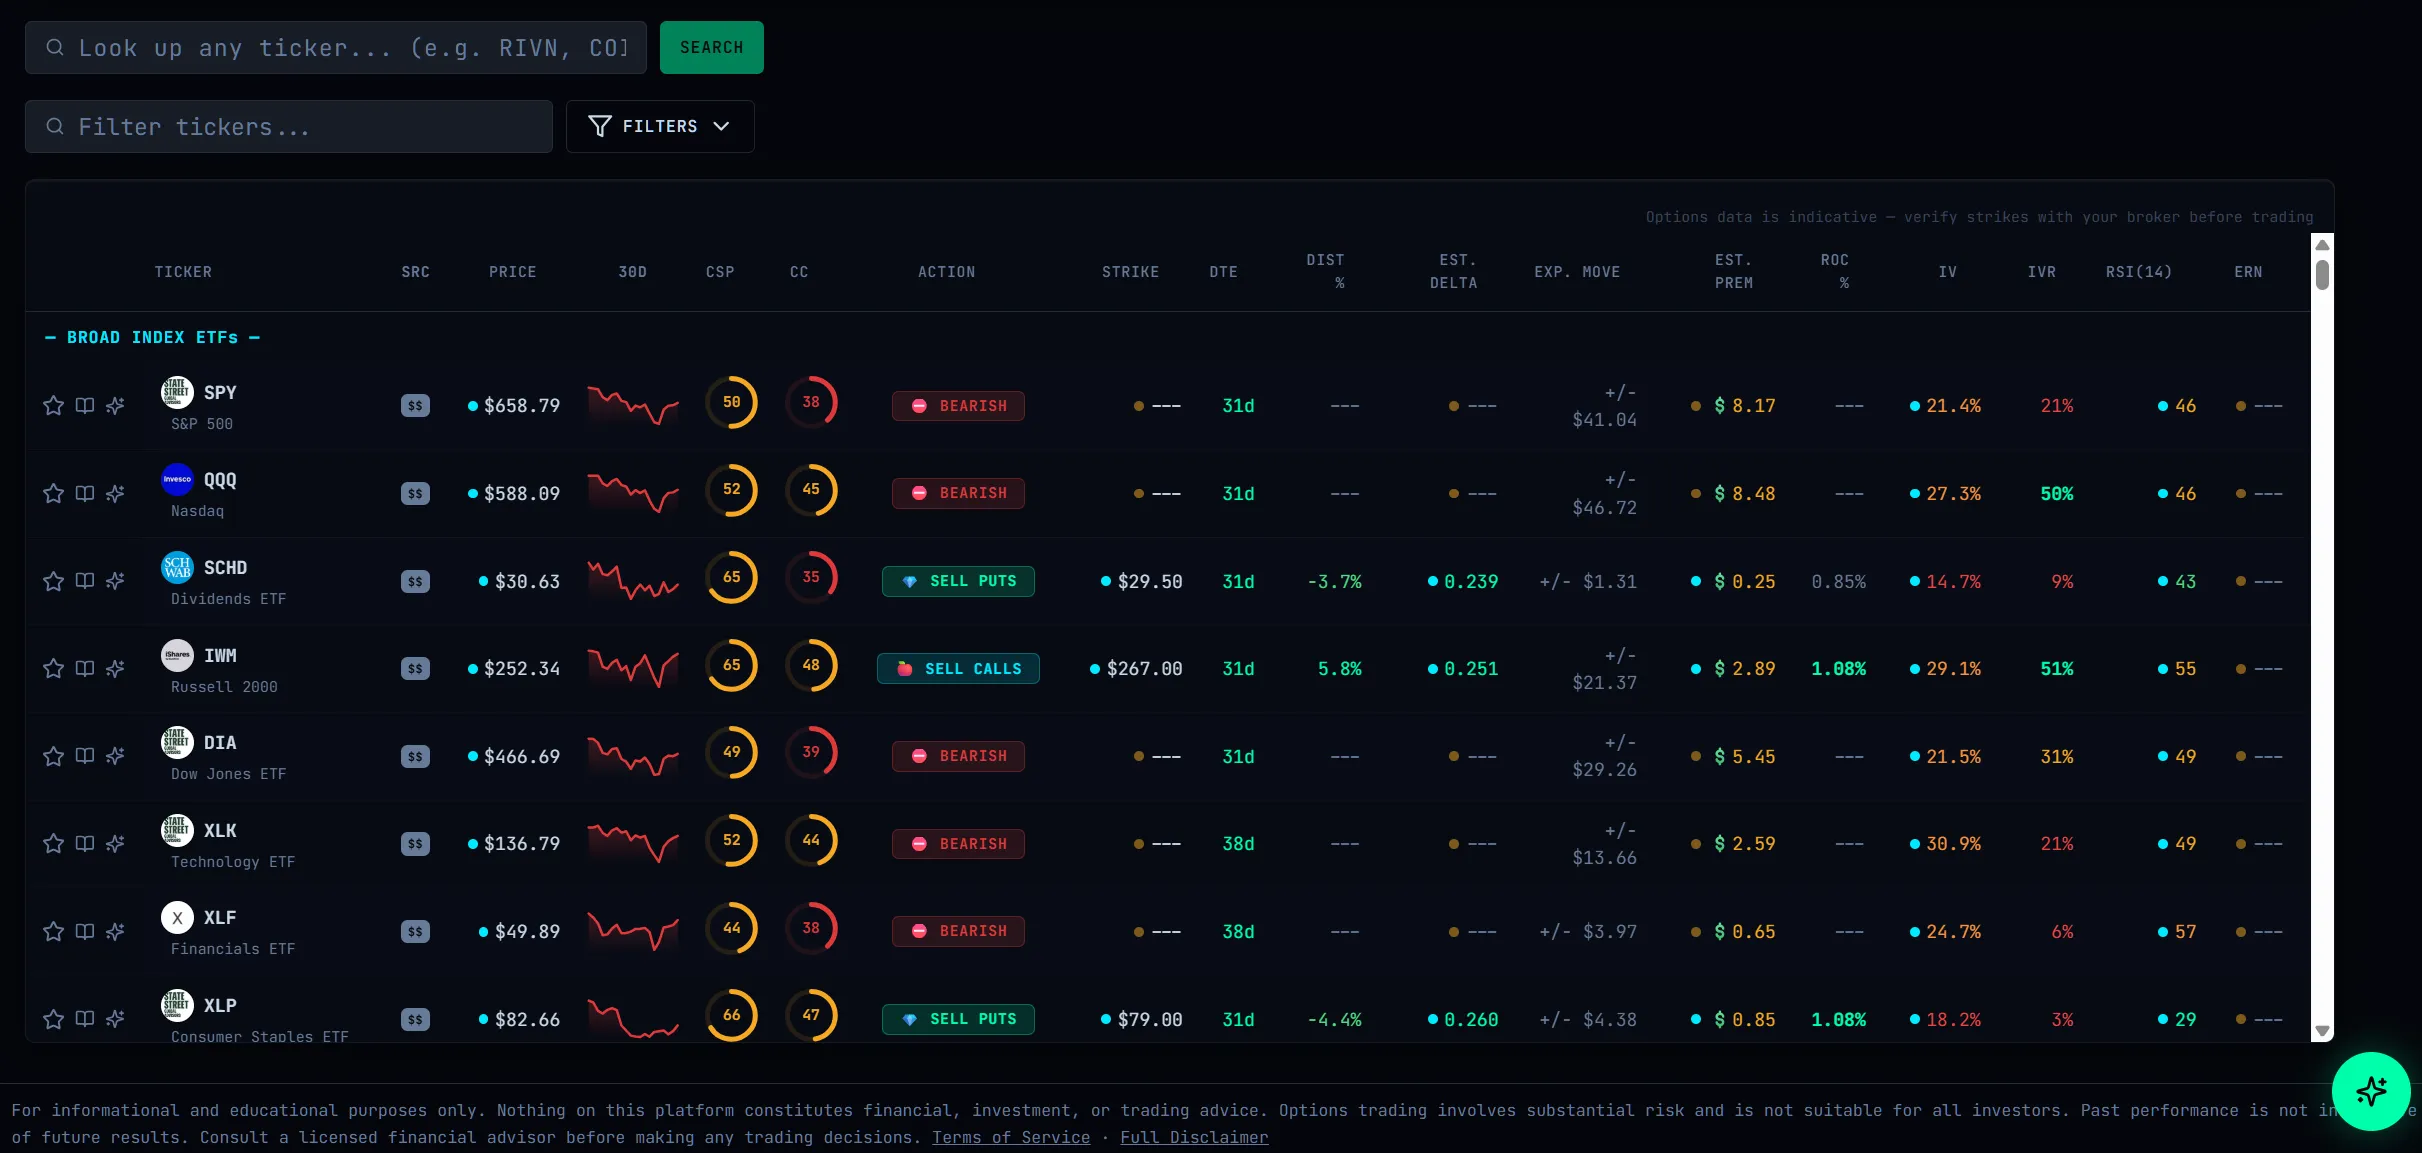
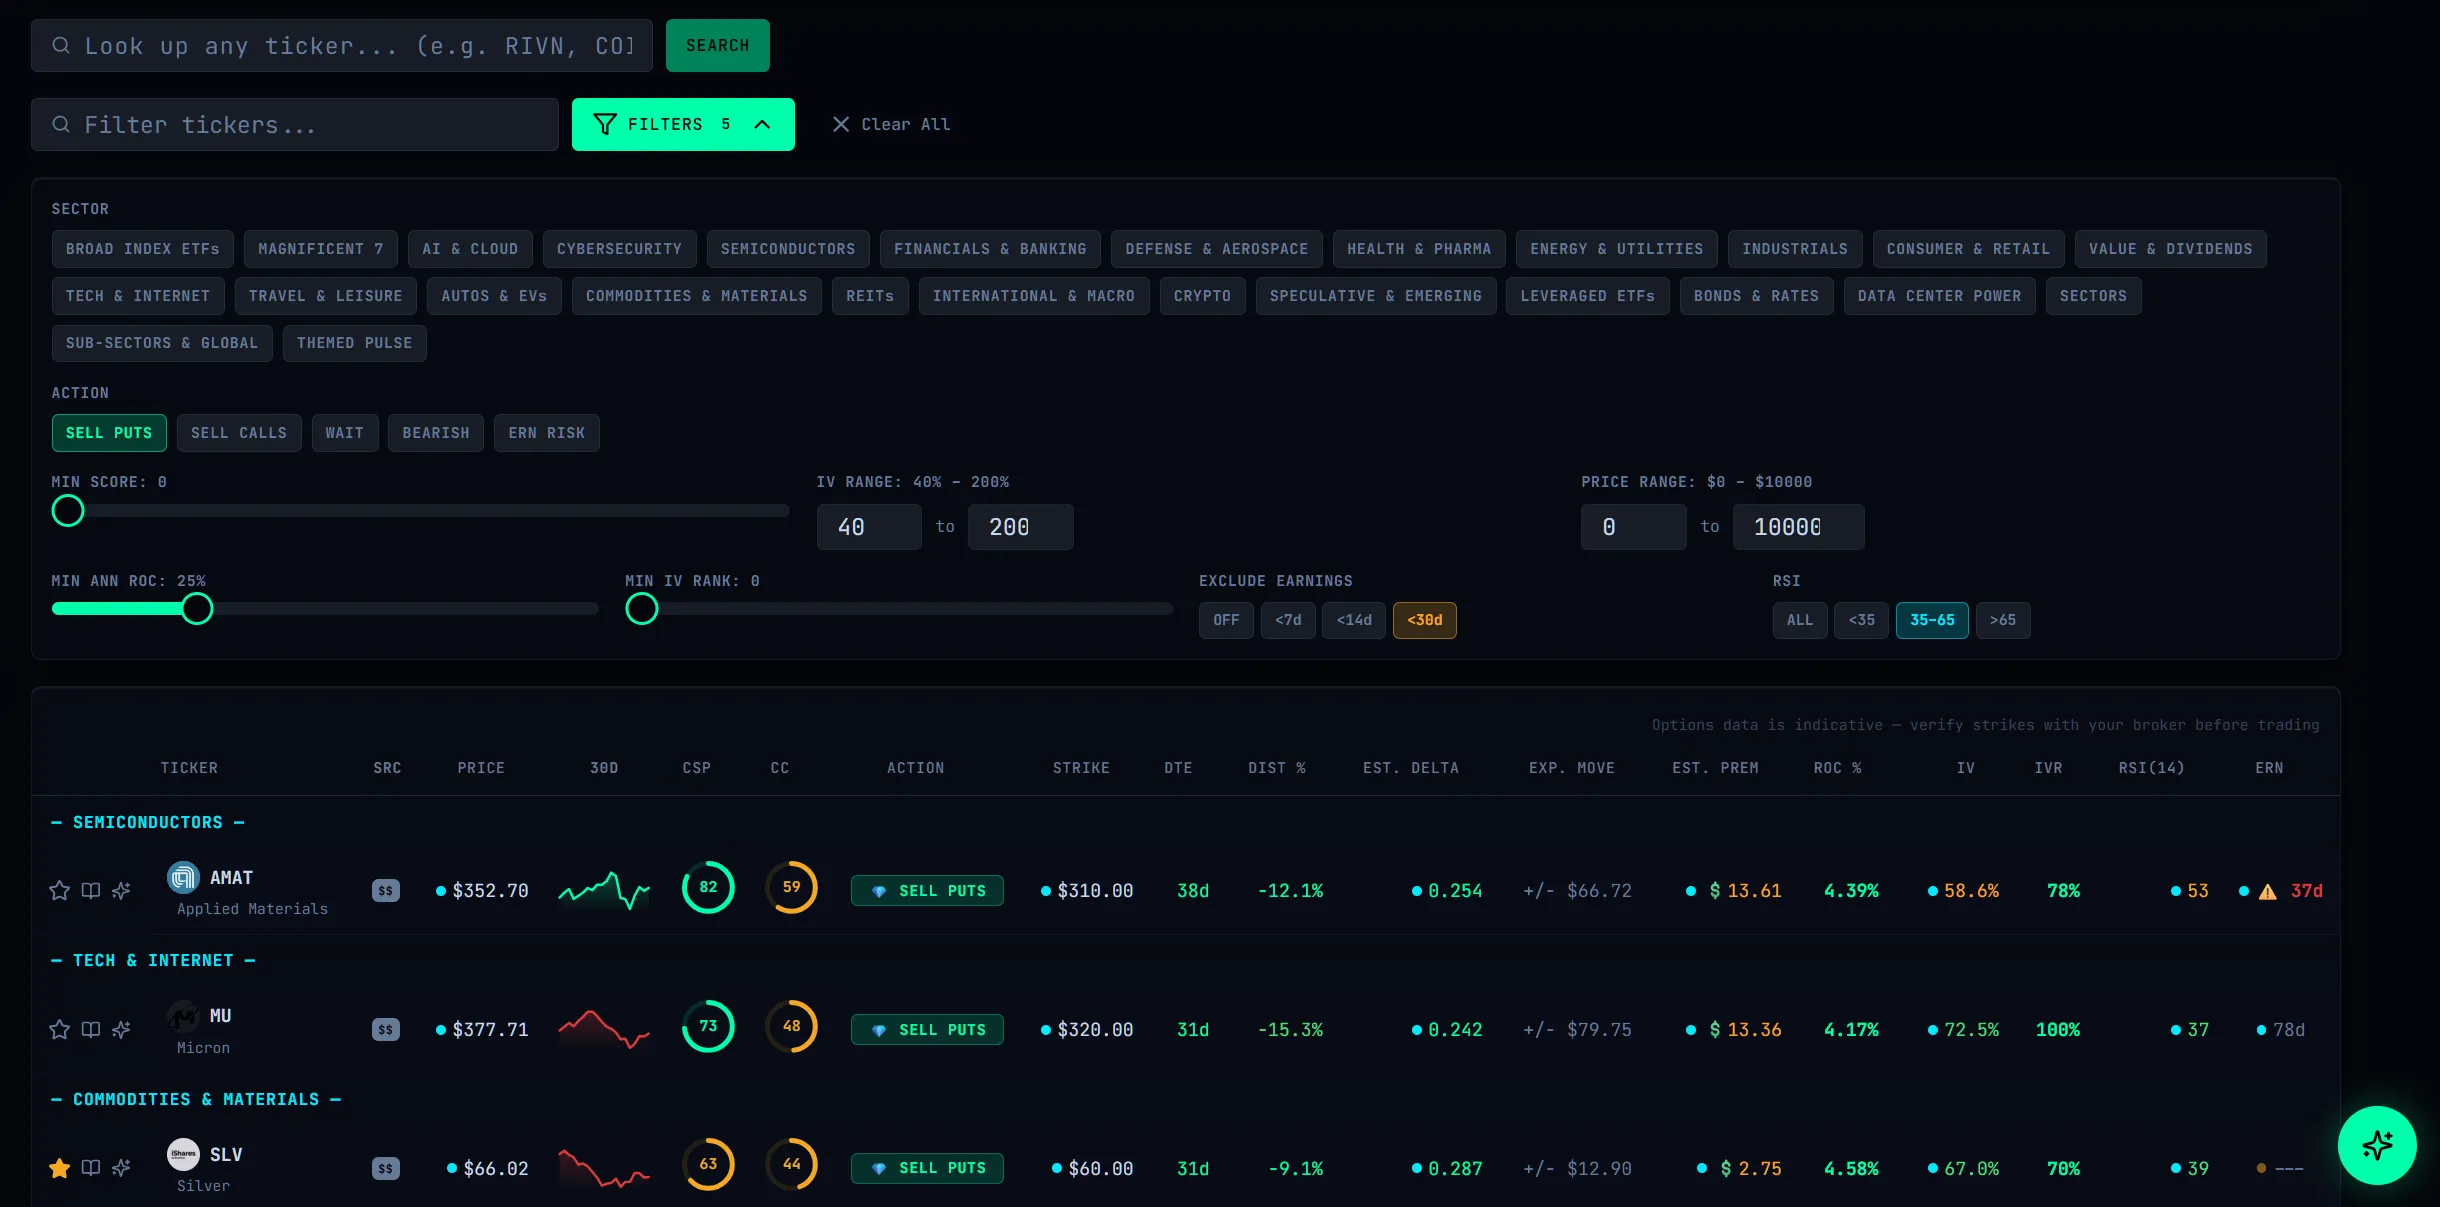
Universal Ticker Scanner
Screen any publicly traded stock and get instant IV, delta, scores, and wheel recommendations. Not limited to a curated list.
300+ Tickers Scored
Every major index, sector ETF, and popular stock ranked by wheel suitability in real time.
Actionable Signals
Color-coded scores, IV rank badges, and delta targets — see the best trades at a glance.
Live Market Data
Prices, Greeks, and technicals refresh automatically so you never trade on stale data.
Deep Dive Into Any Ticker
Professional-grade charting with technical indicators, all synced to a single crosshair.
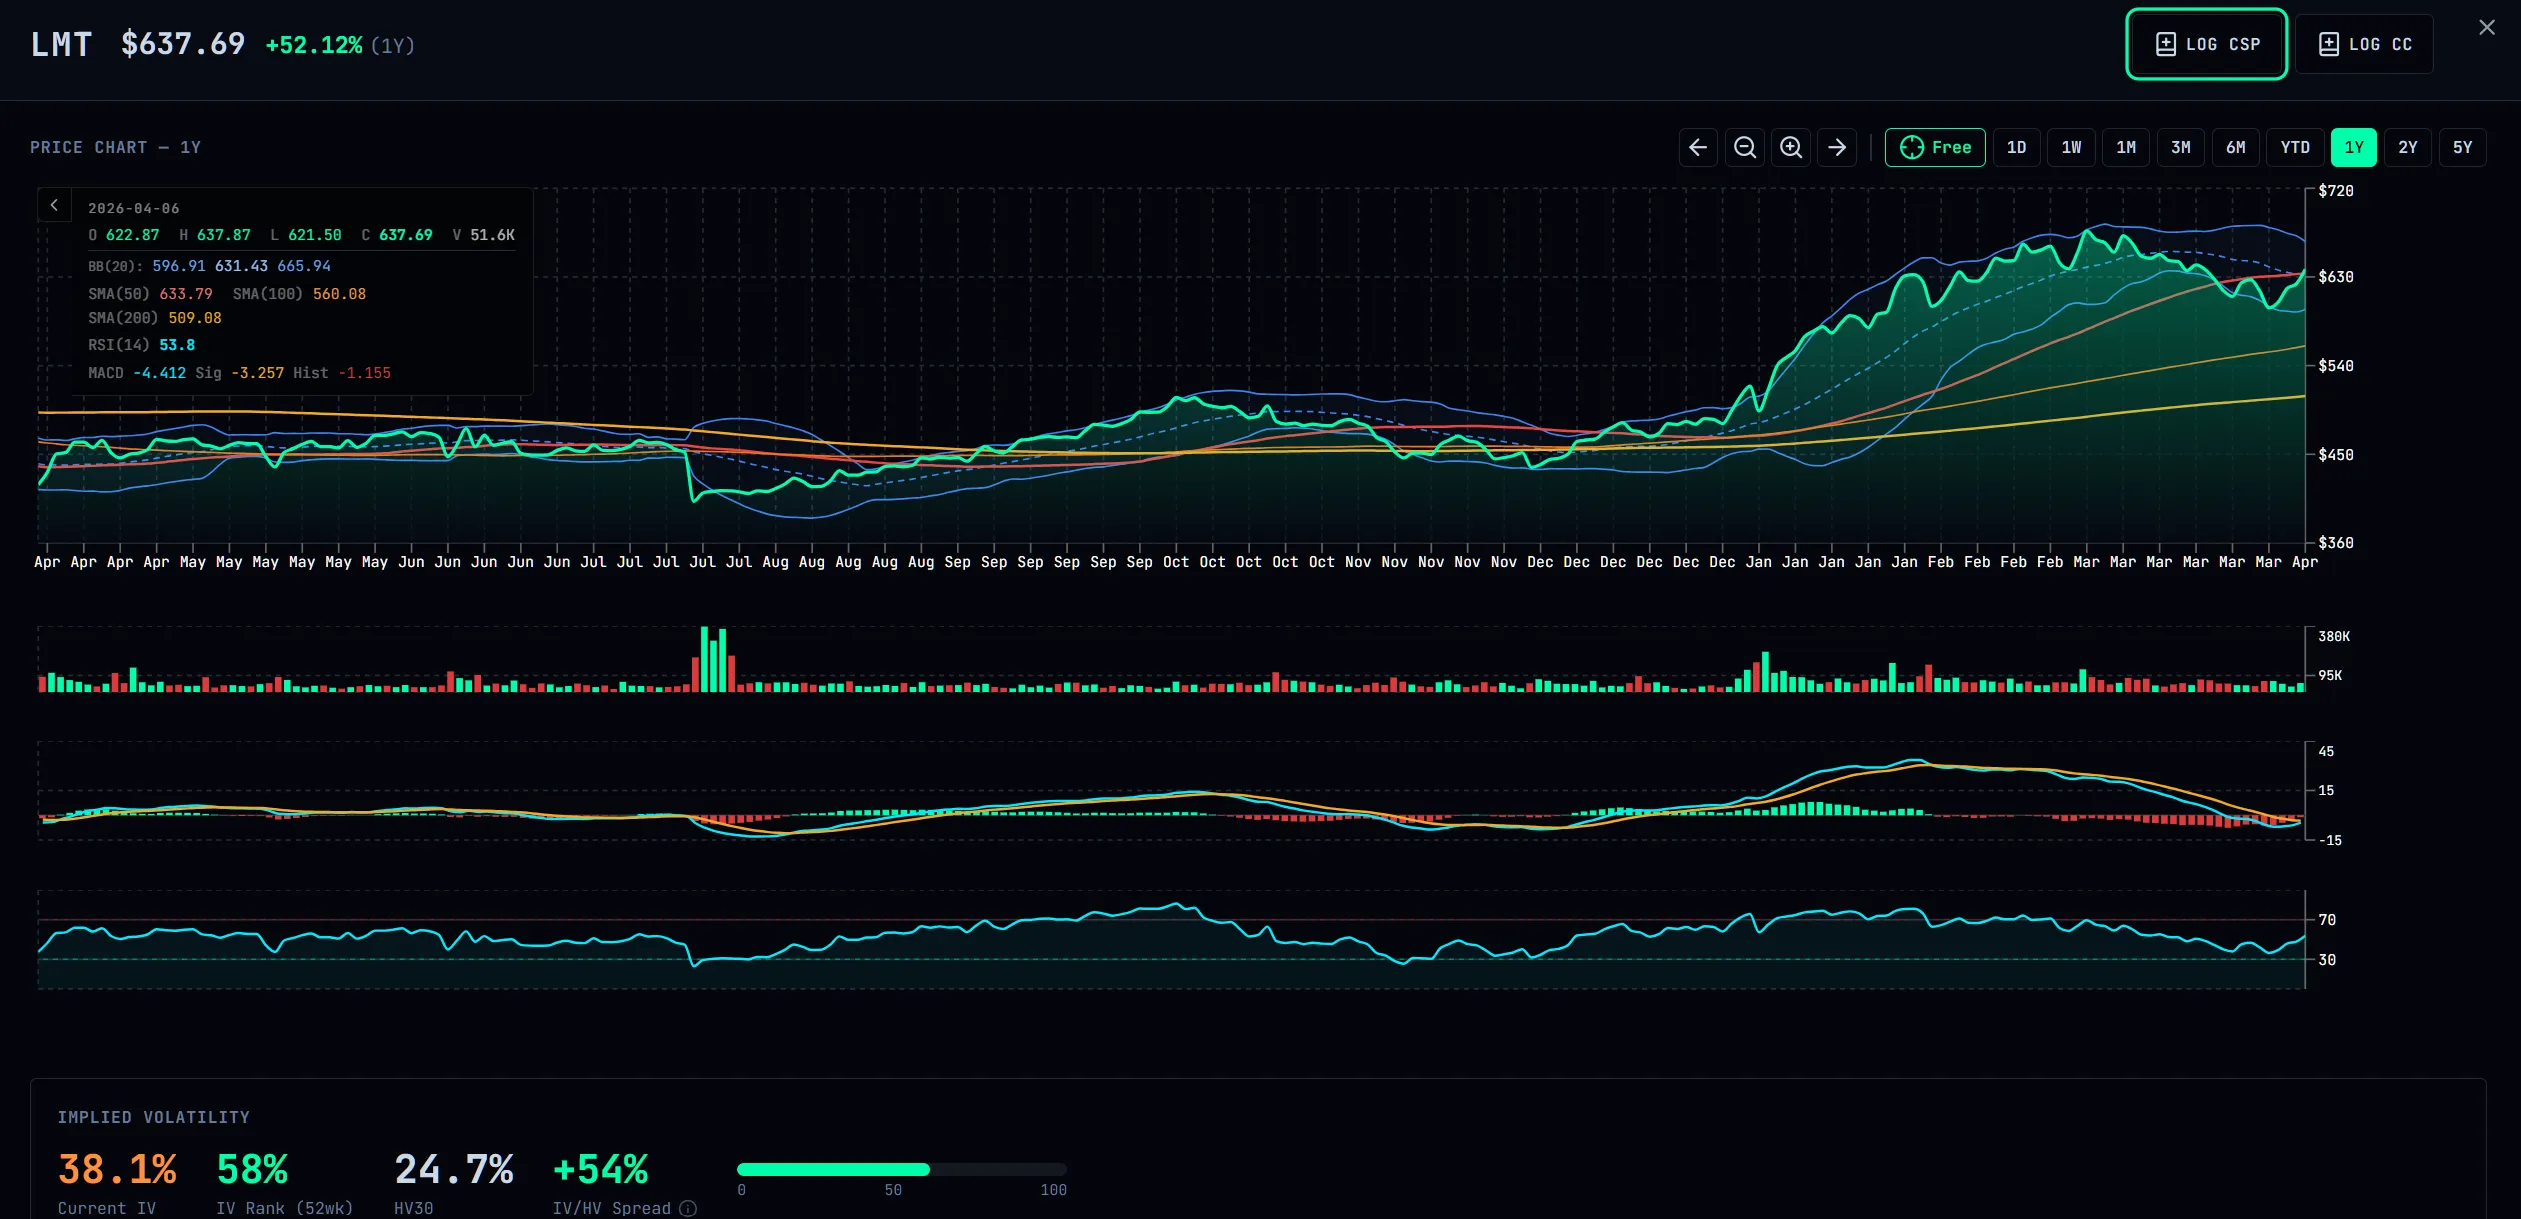
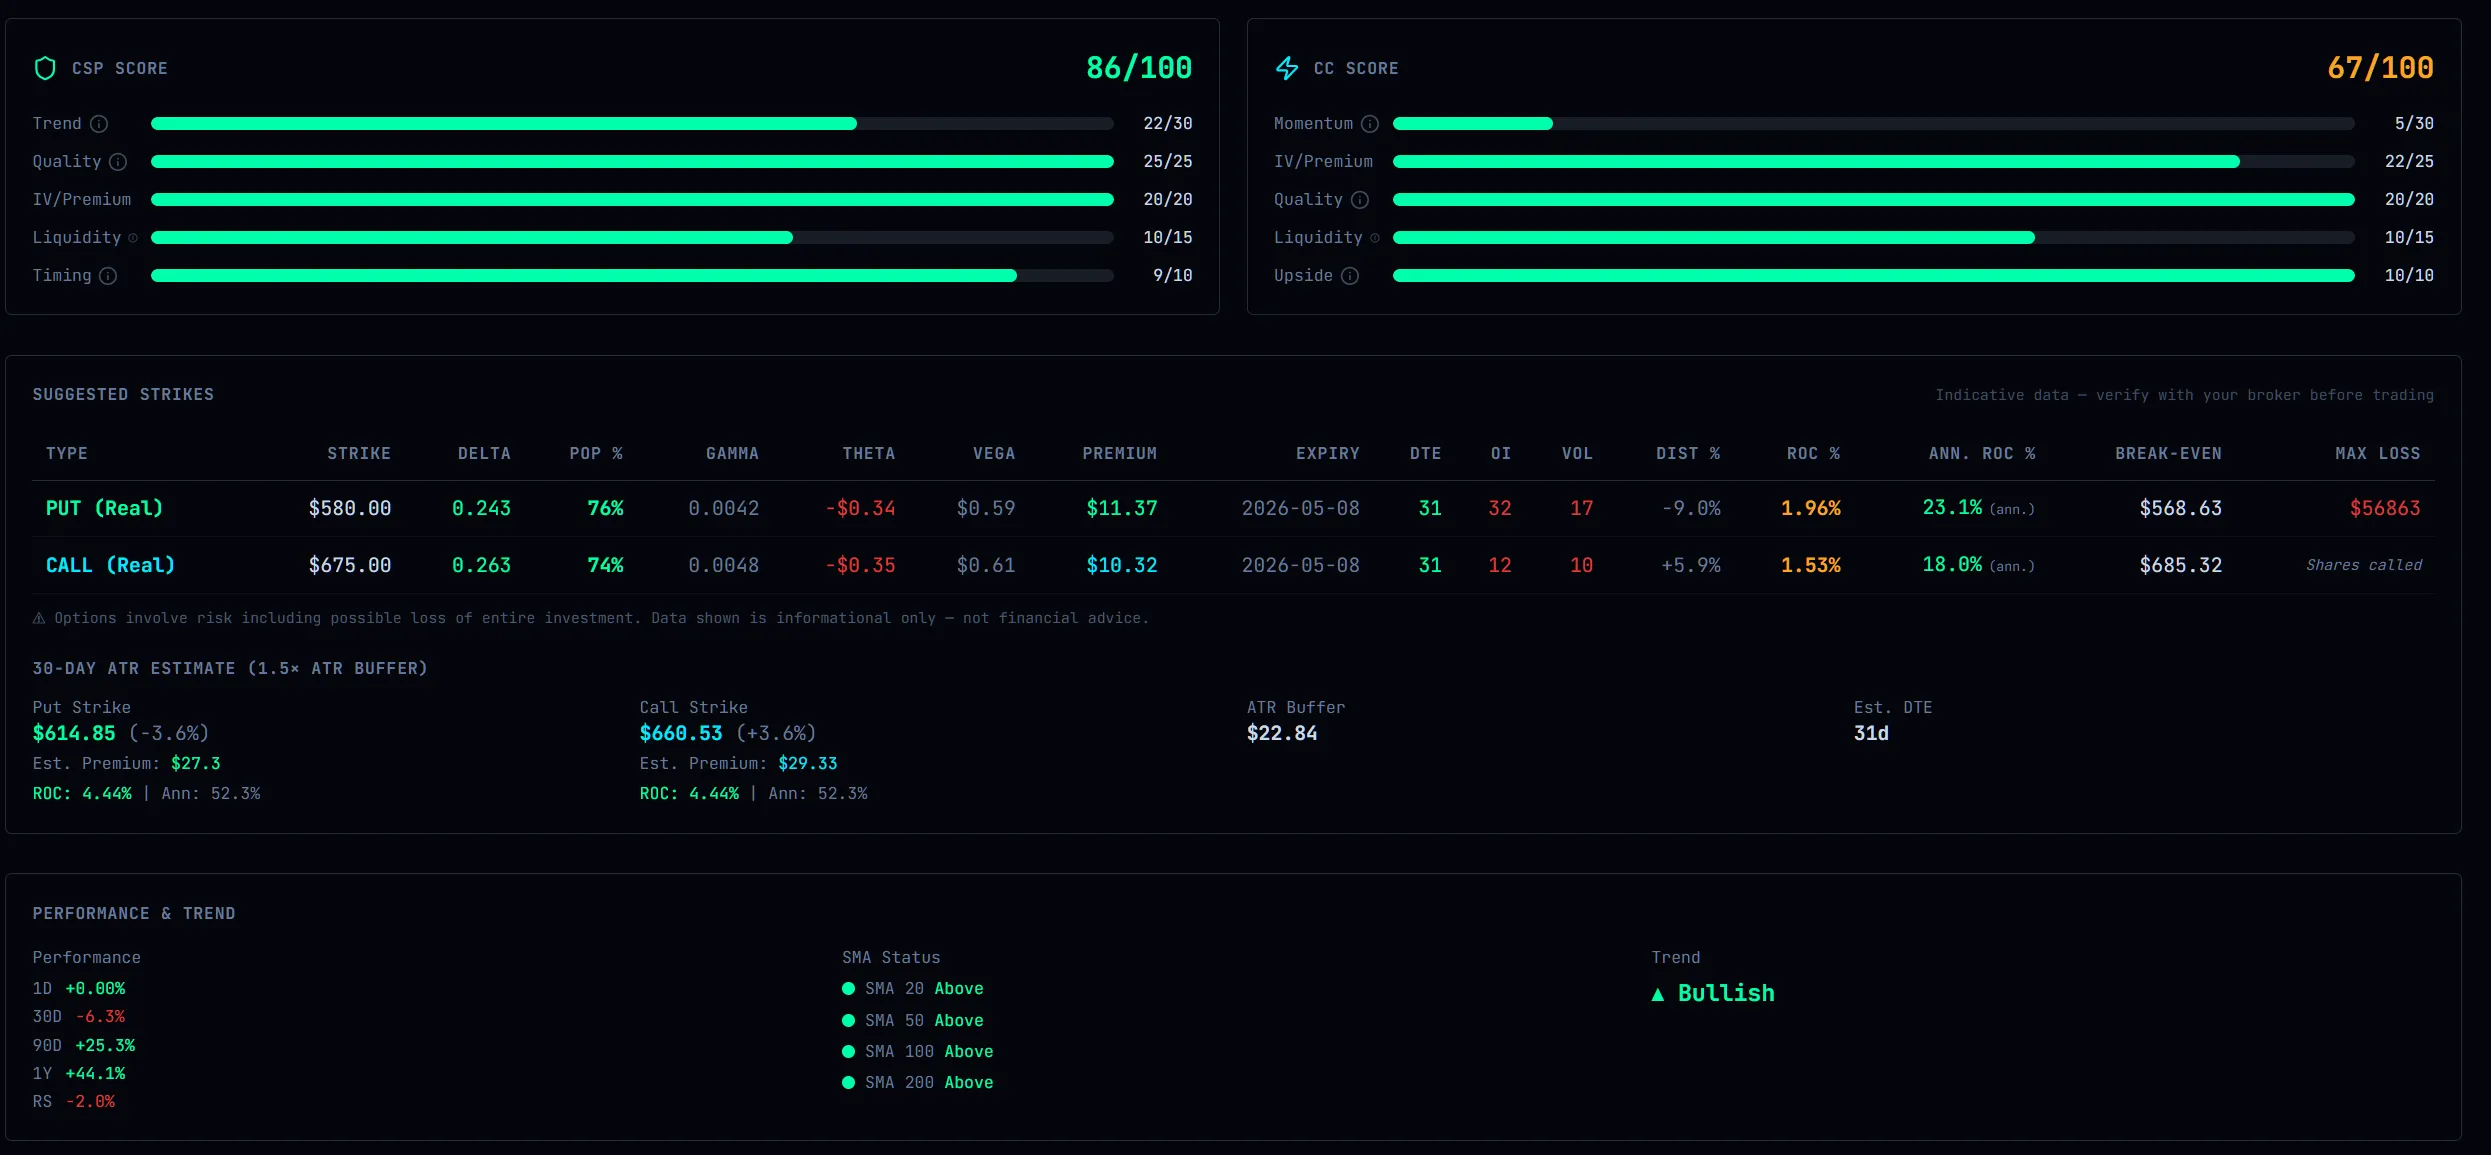

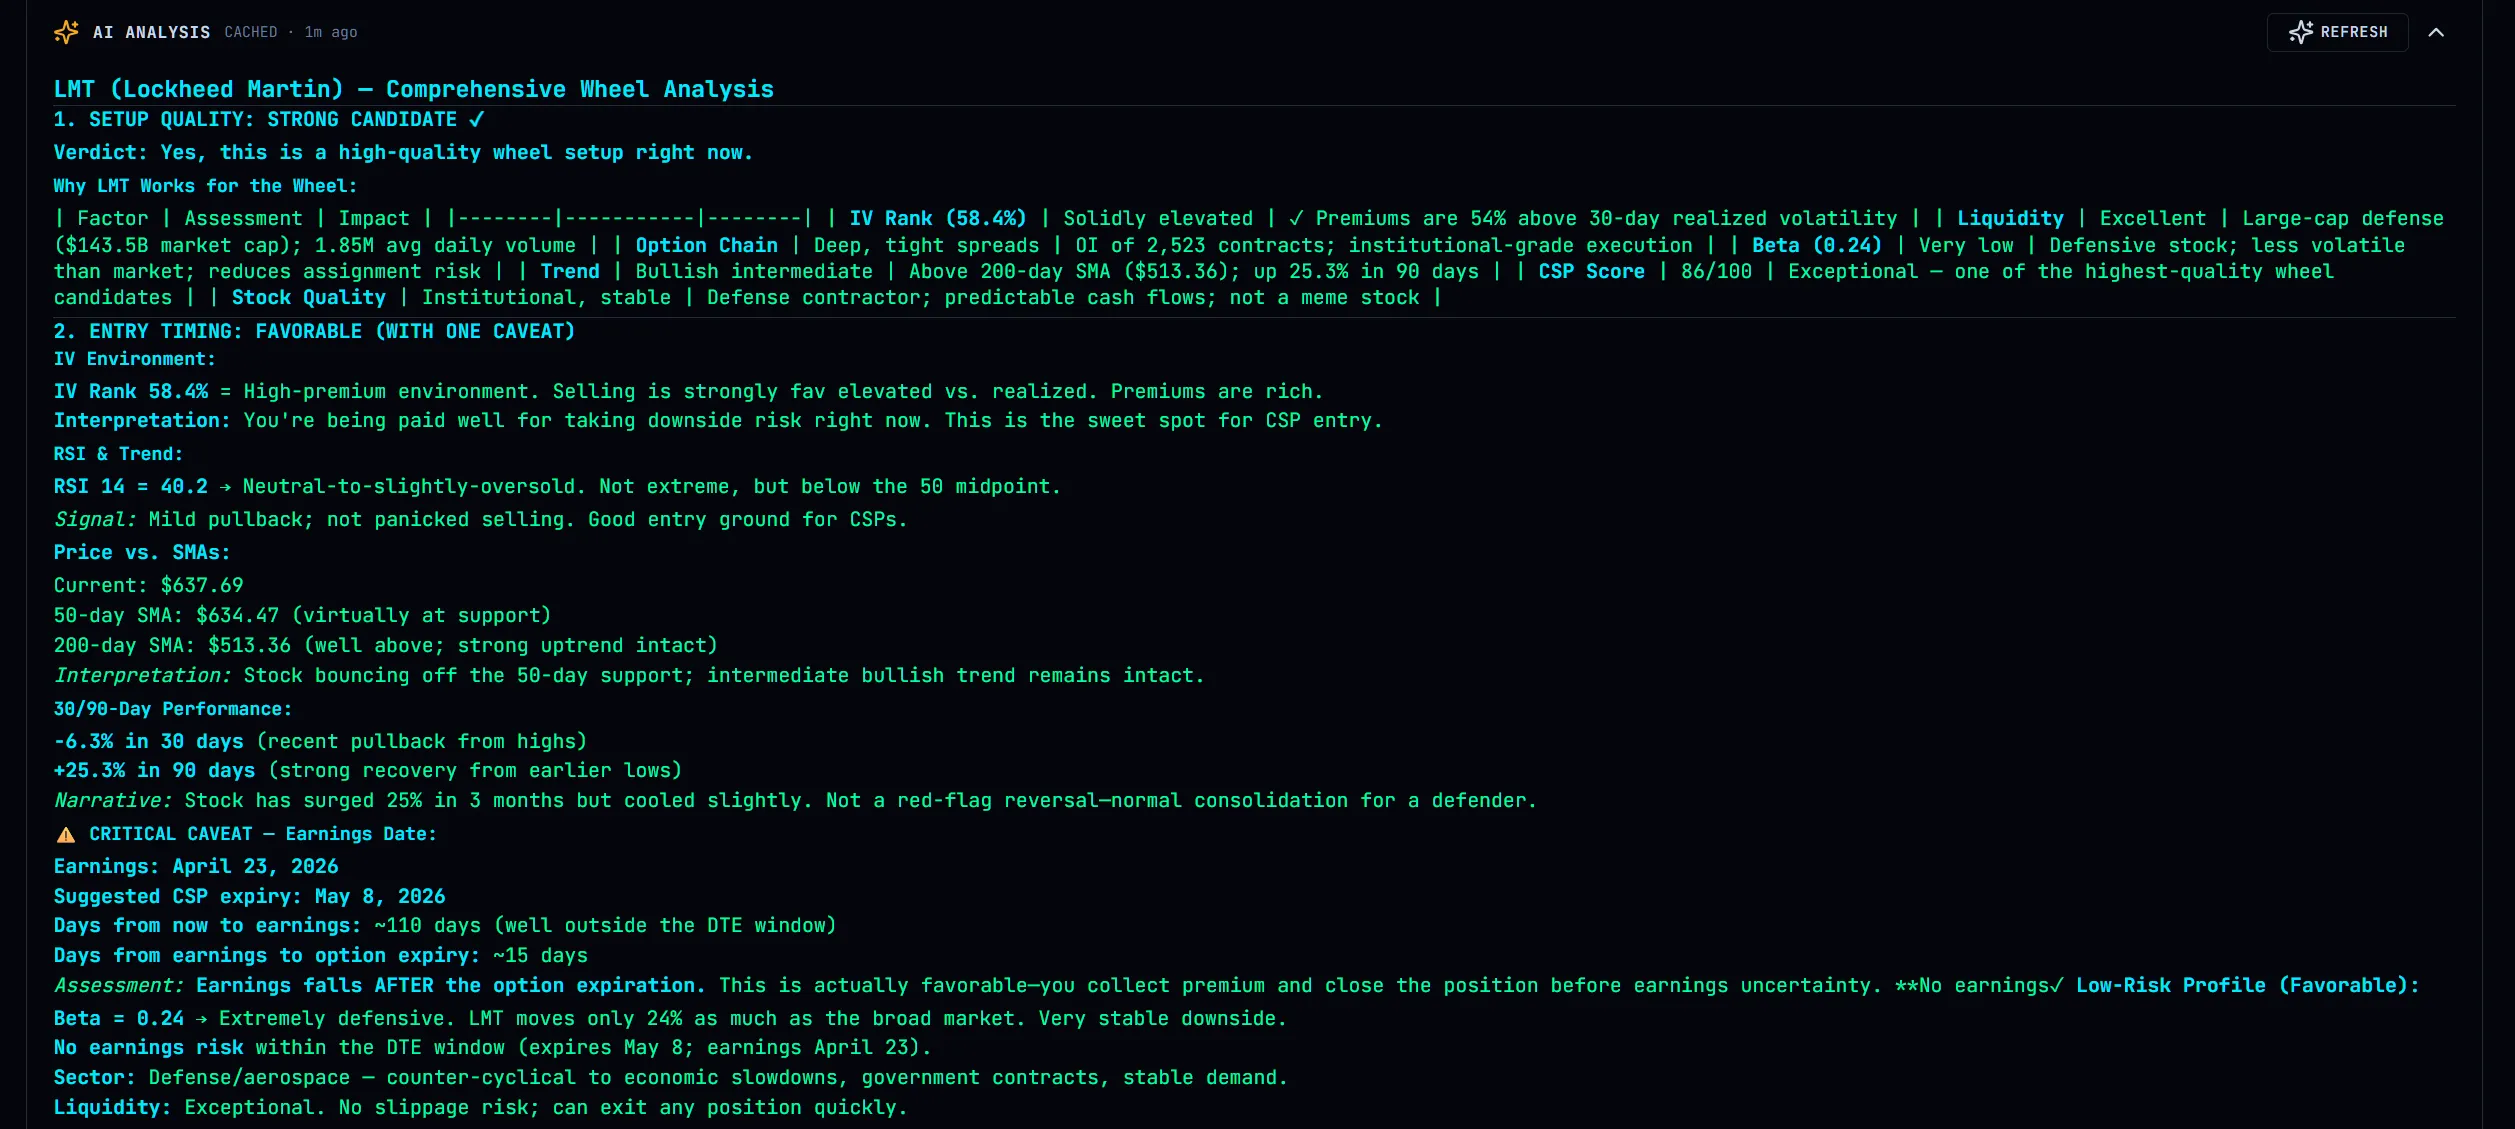
Synced Subplots
Price, volume, MACD, and RSI in vertically stacked charts with a unified crosshair.
Drag-to-Zoom
Select any range to zoom in. One click to reset. Touch-friendly on mobile.
Real-Time Overlay
OHLCV, indicator values, and scores displayed in a fixed overlay — no tooltip chasing.
Your Watchlist, Always Alert
Monitor your favorite wheel tickers with smart, multi-type alerts — price targets, IV spikes, RSI levels, and auto-detected wheel entry signals. Get notified the moment a setup forms.
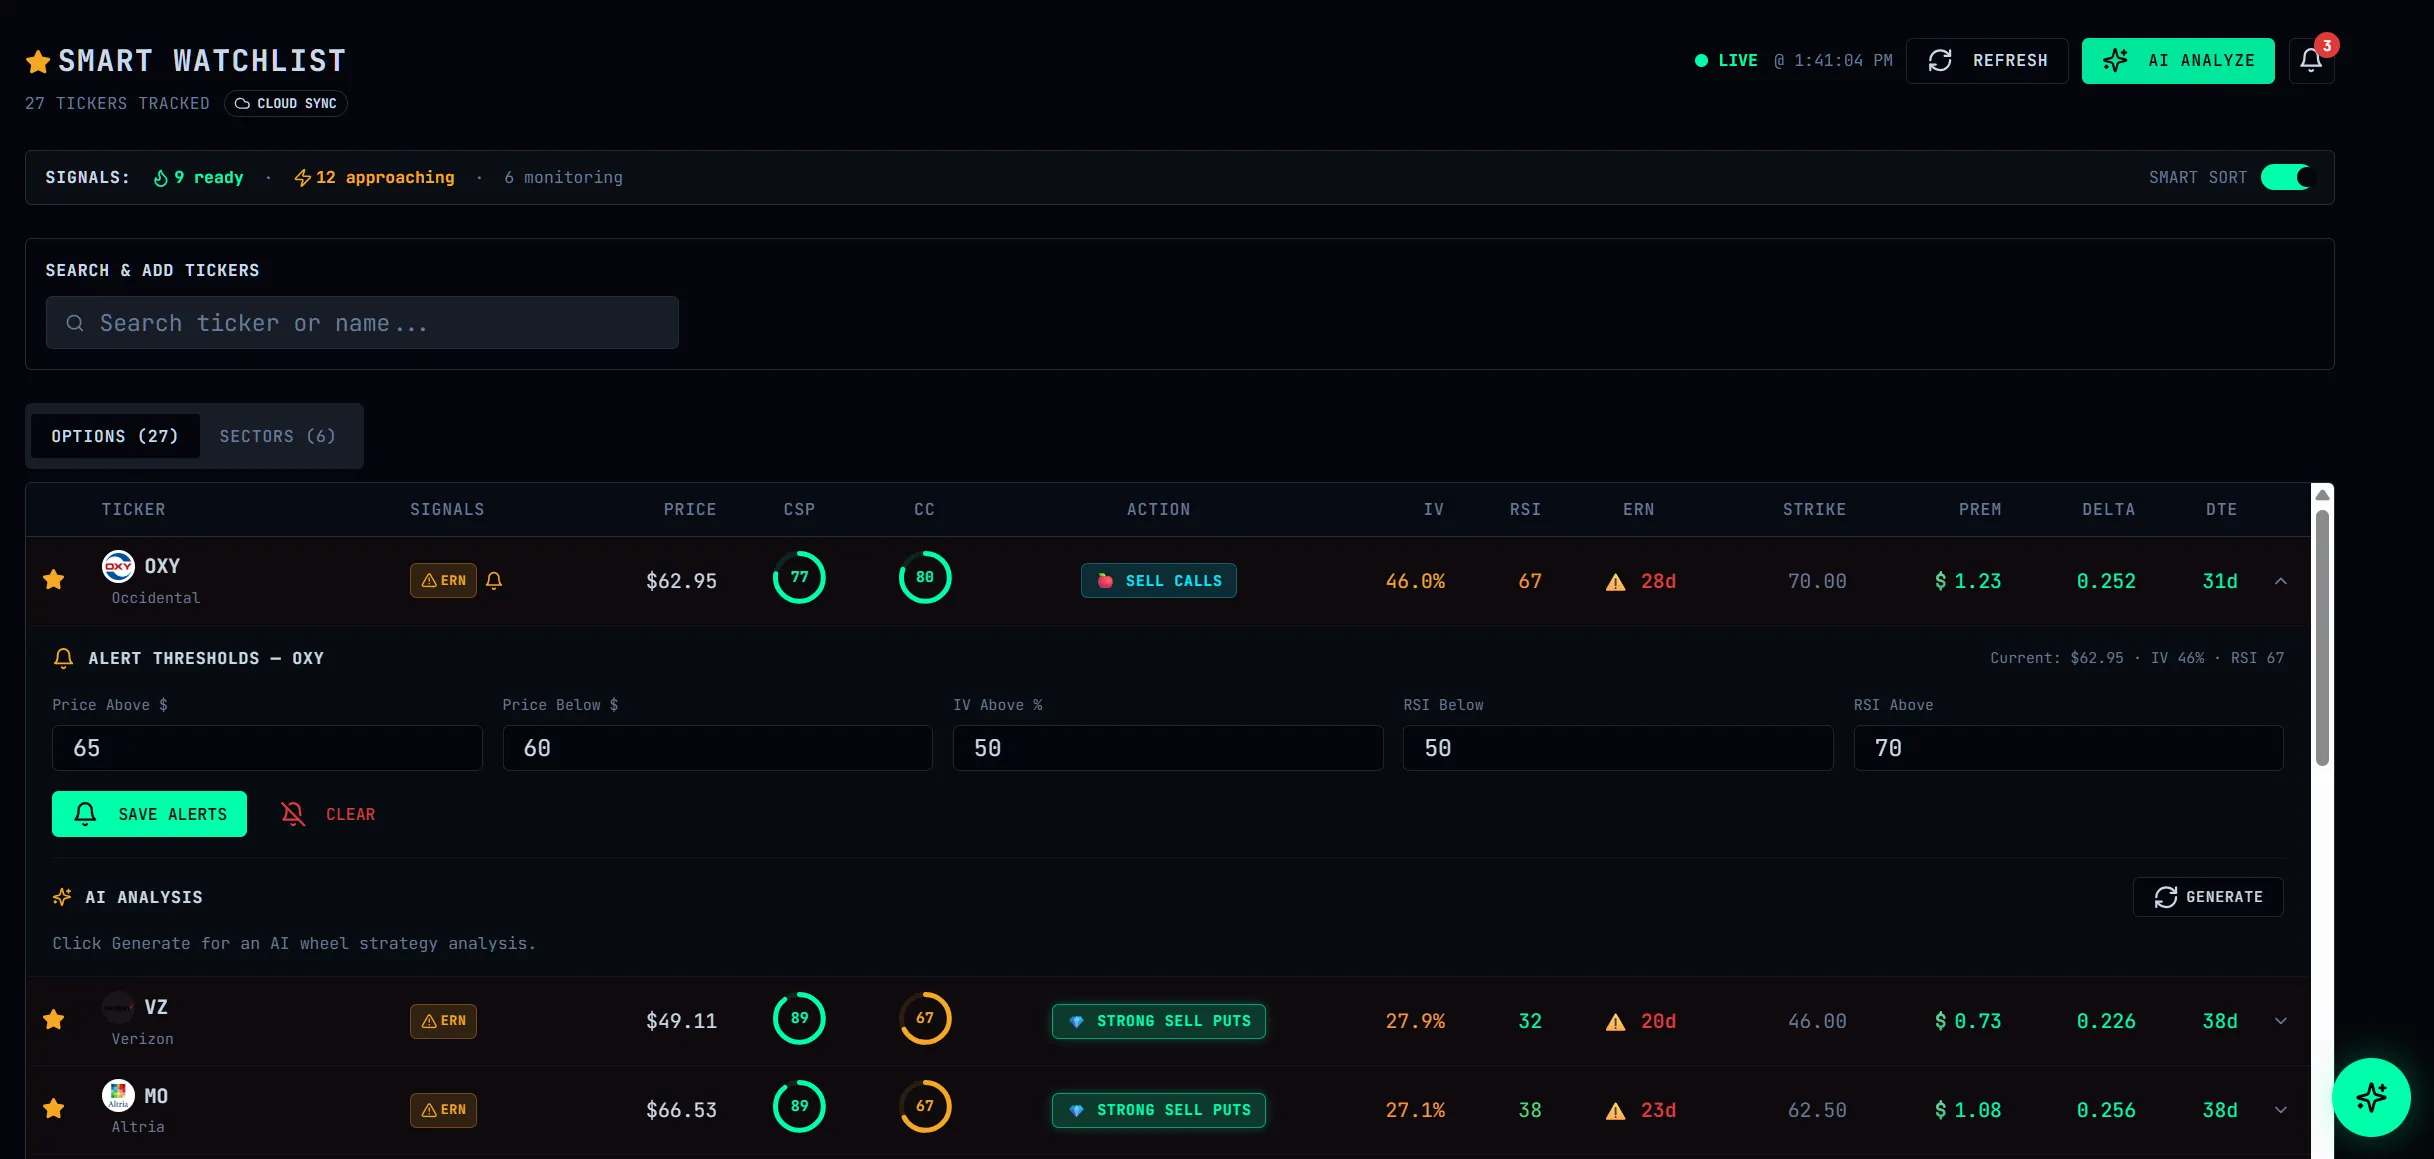
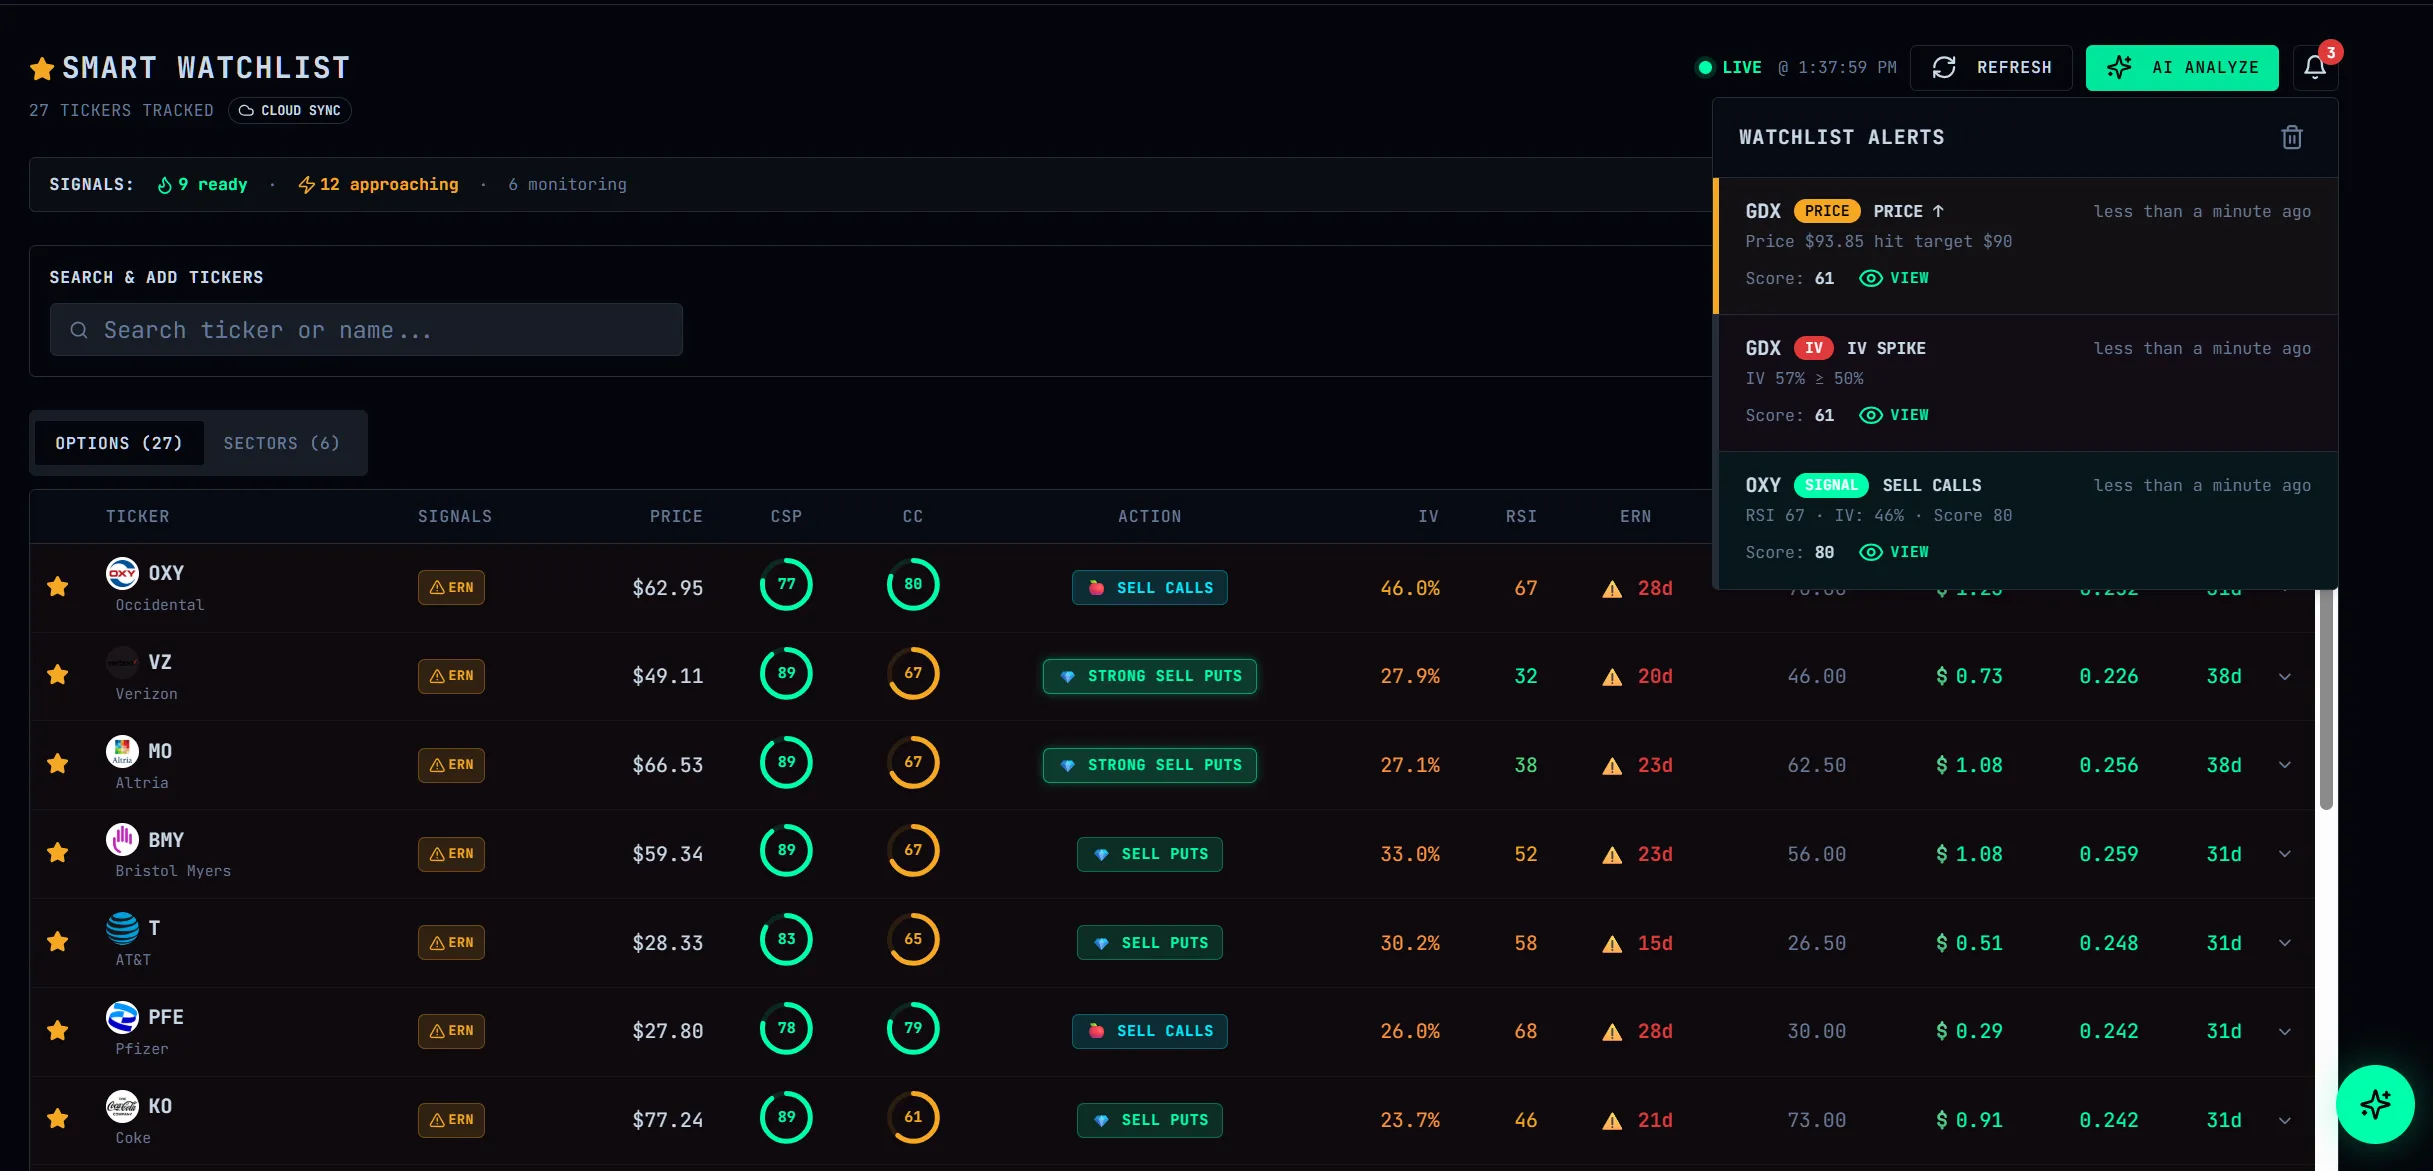
Multi-Type Alerts
Set price, IV rank, and RSI thresholds per ticker. WheelLogic fires an alert the moment any condition is met — with a 30-min cooldown to keep the noise out.
Smart Signal Detection
Auto-detects CSP and CC entry setups based on RSI, IV rank, and wheel score. HOT and ENTRY badges surface the best setups the moment they form — no manual scanning needed.
AI Entry Insights
When a signal fires, an AI brief is auto-generated with entry timing context, IV environment, and position sizing suggestions. The global AI copilot also has full watchlist context when you're on this page.
Cloud-Synced & Persistent
Your tickers, thresholds, and alert history sync to the cloud when logged in. Switch devices and never lose your setup. Alert history stores your last 50 signals.
Never Get Caught by Earnings Again
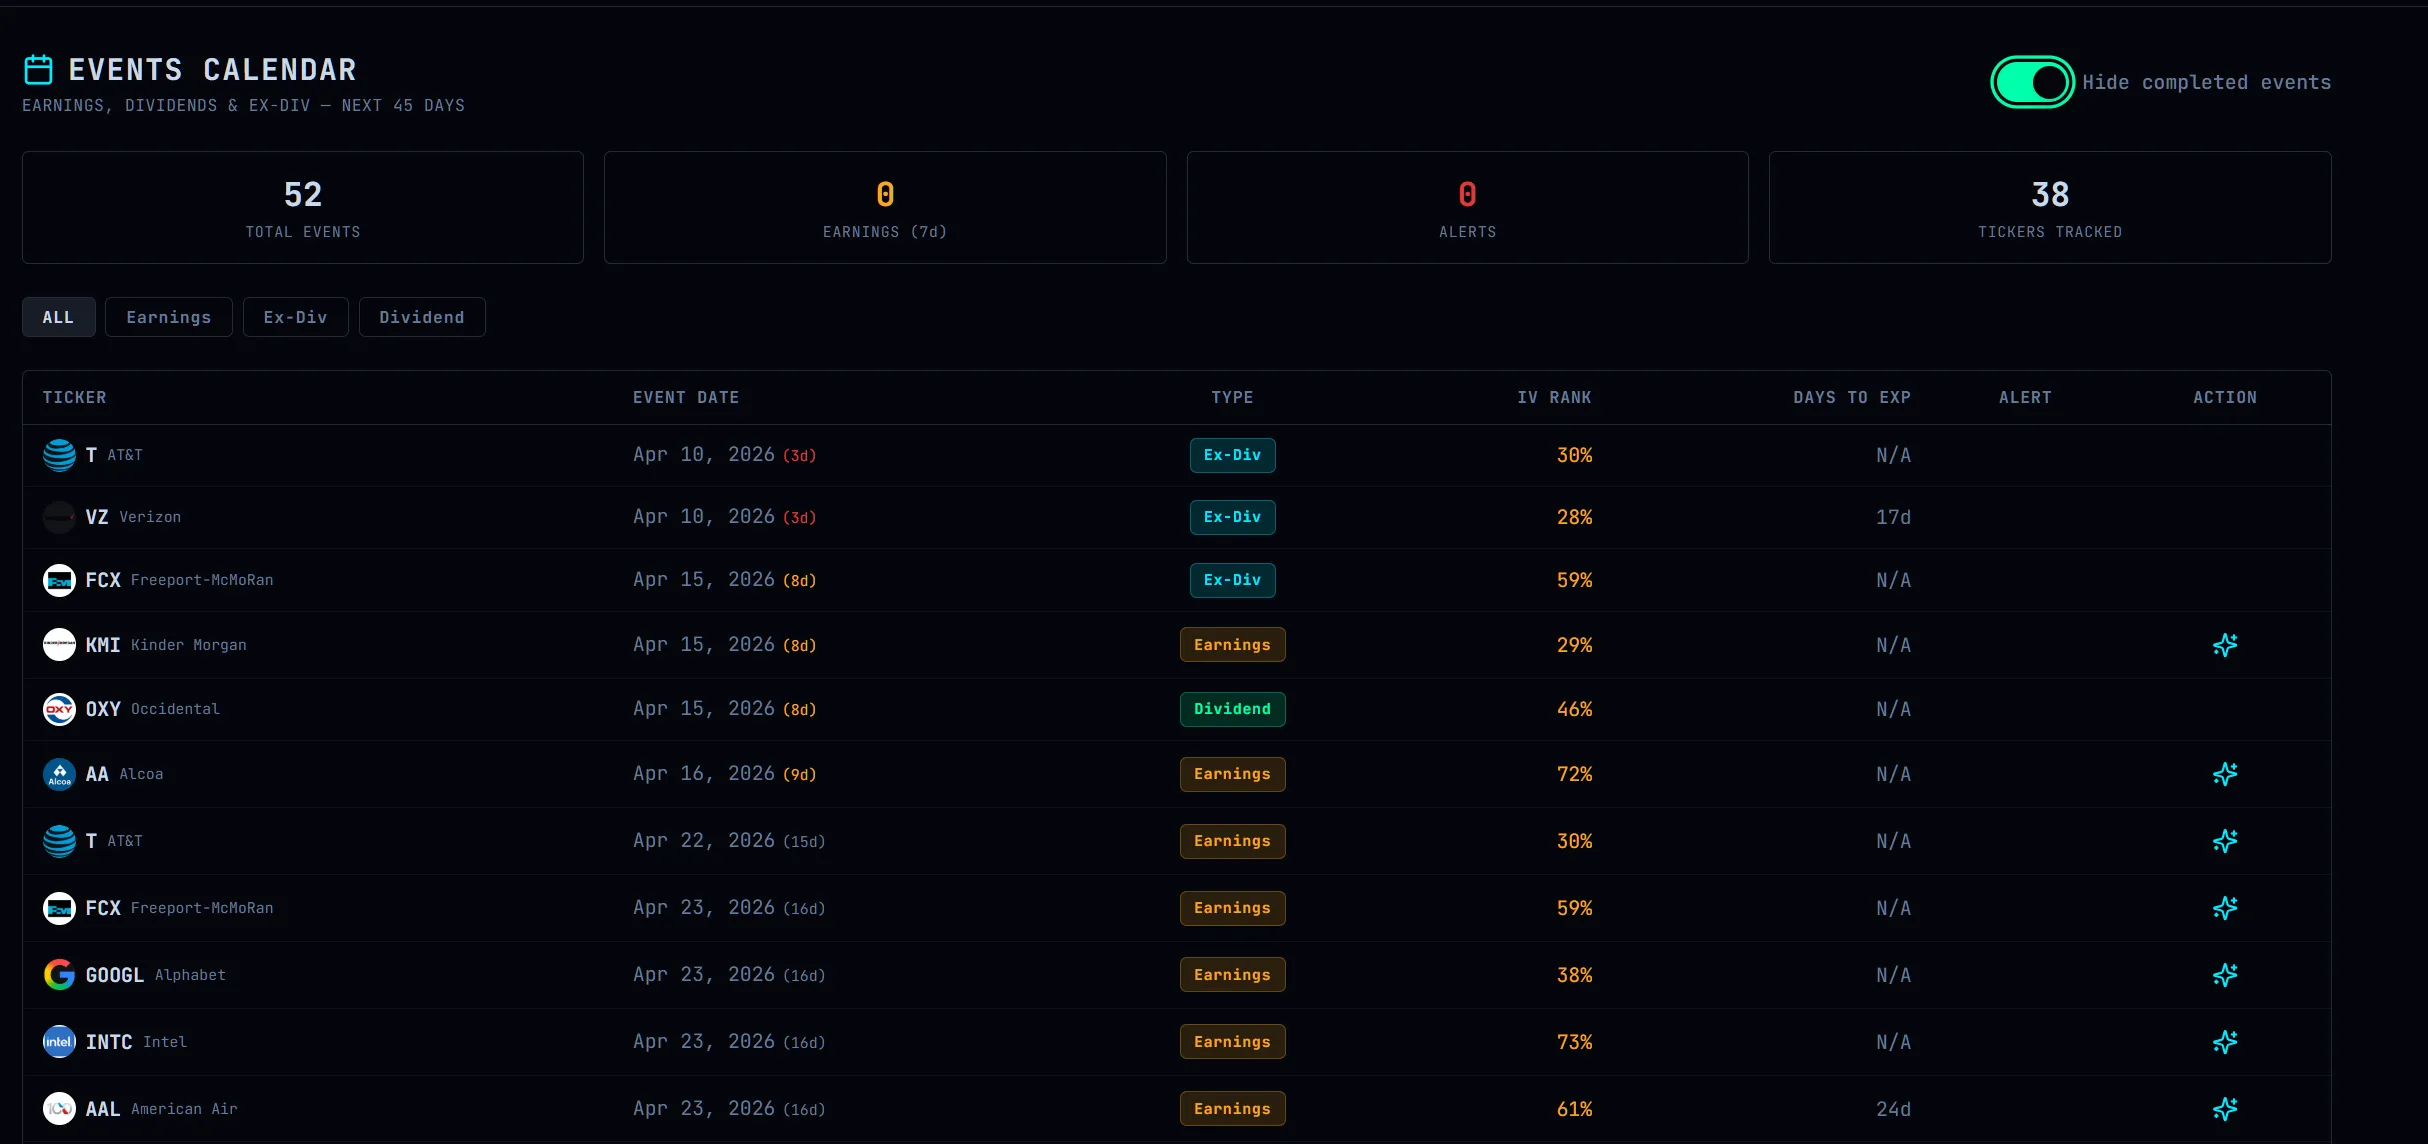
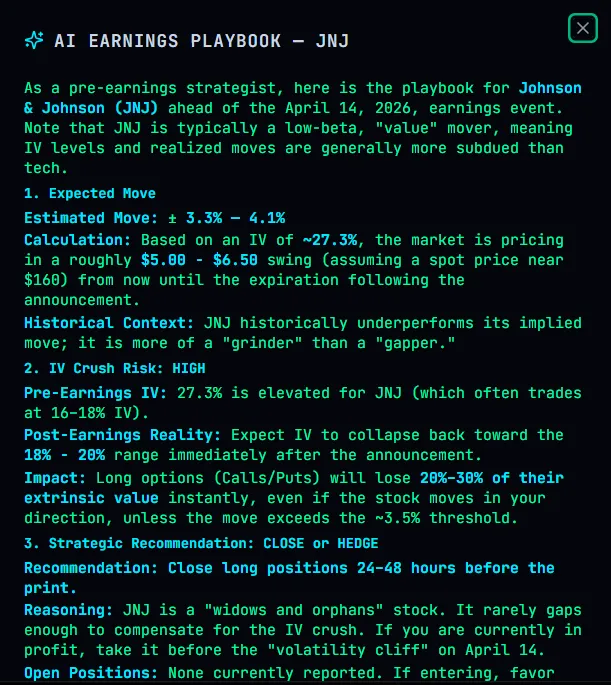
The Events Calendar surfaces earnings dates, ex-dividend dates, and dividend payments for every ticker you watch or trade — 45 days out. Risk alerts fire automatically when an earnings date threatens an open position, and an AI playbook is one click away.
45-Day Event Horizon
Every earnings report, ex-dividend date, and dividend payment across your watchlist and open trades — in a single ranked view. Covers 45 days so you always have time to act.
Earnings Risk Alerts
Automatic RISK flagging when an earnings date falls within 7 days of your trade's expiration. Consider Rolling and Avoid New Puts suggestions are surfaced inline — no manual cross-referencing required.
AI Earnings Playbook
One click generates a tailored AI playbook for any upcoming earnings event: IV environment analysis, roll vs. close guidance, and position sizing context — all pre-loaded with your open trade data.
Smart Coverage
Events automatically tracked for your full watchlist, every open trade, and the current top CSP and CC opportunities — so you never have a blind spot heading into a volatile event.
Run the Wheel Before You Risk a Dollar
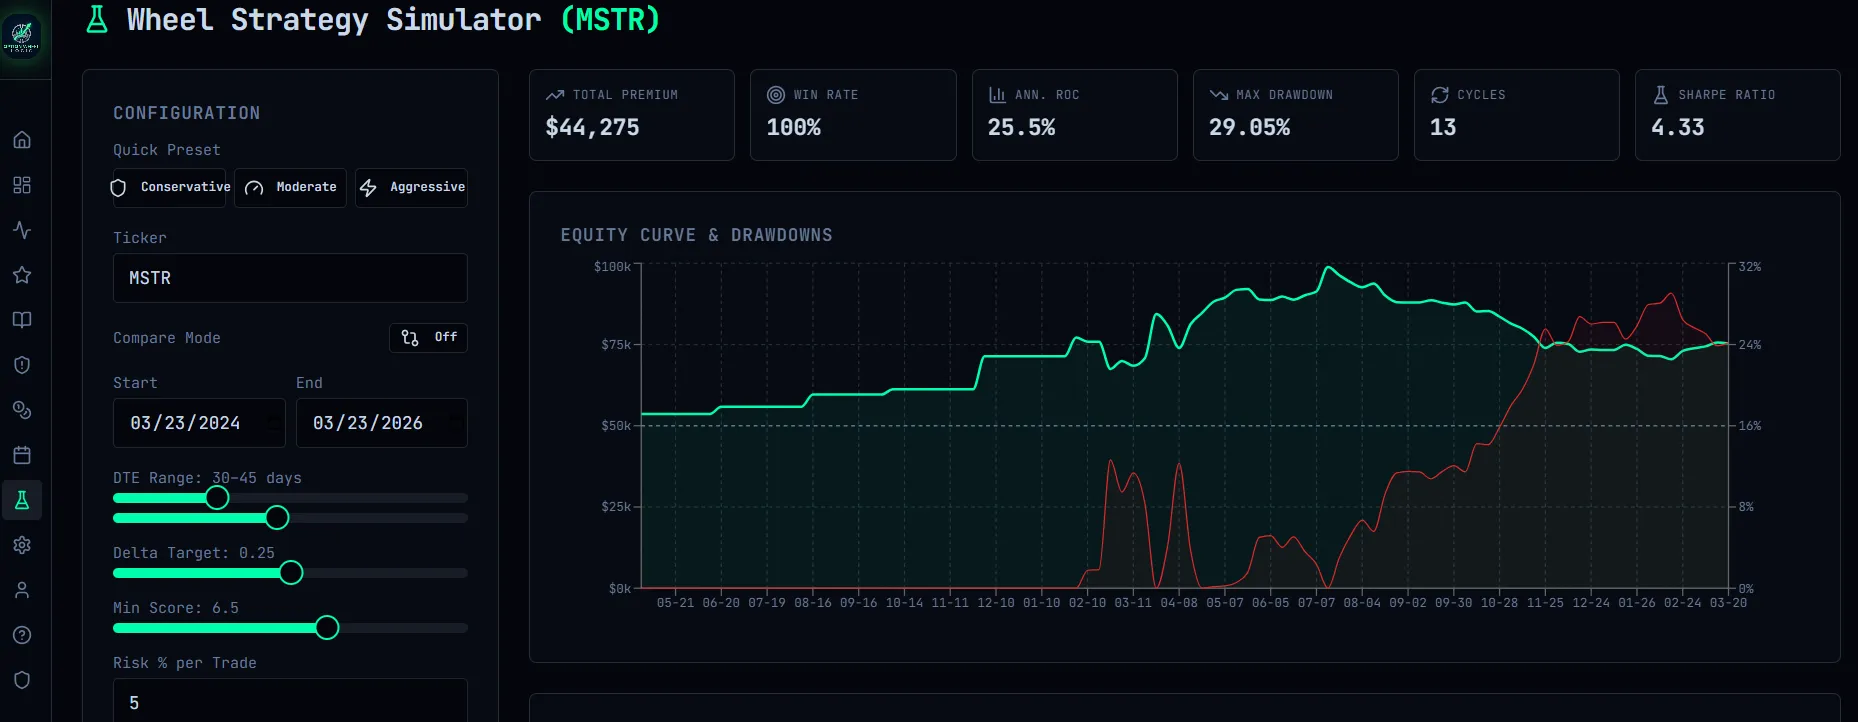
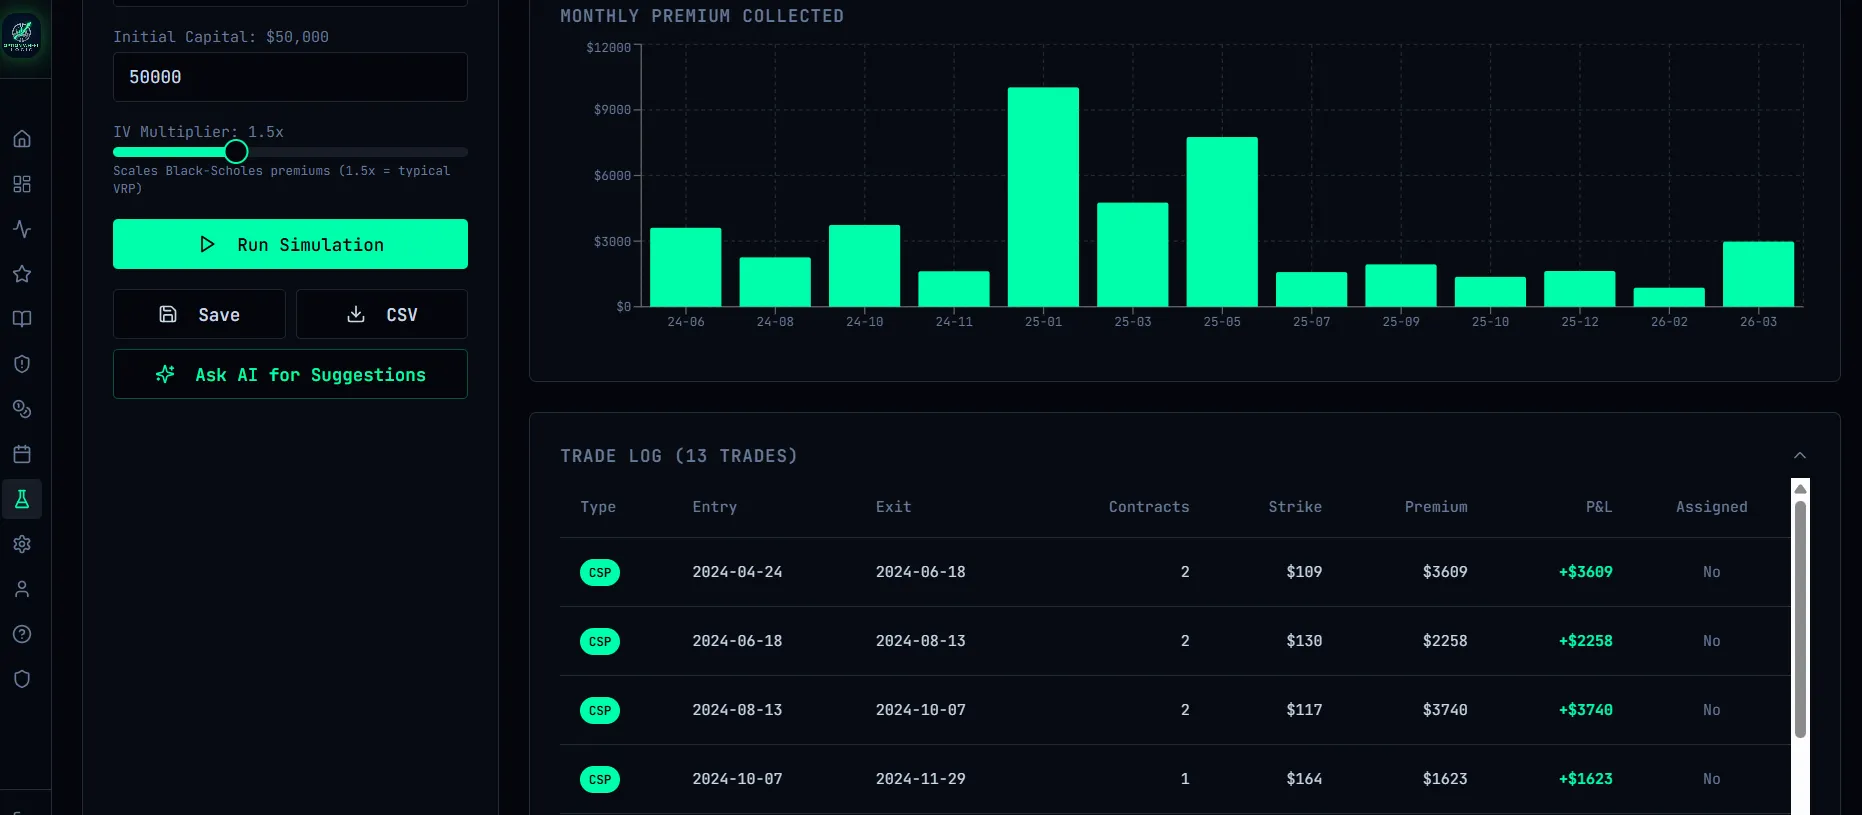
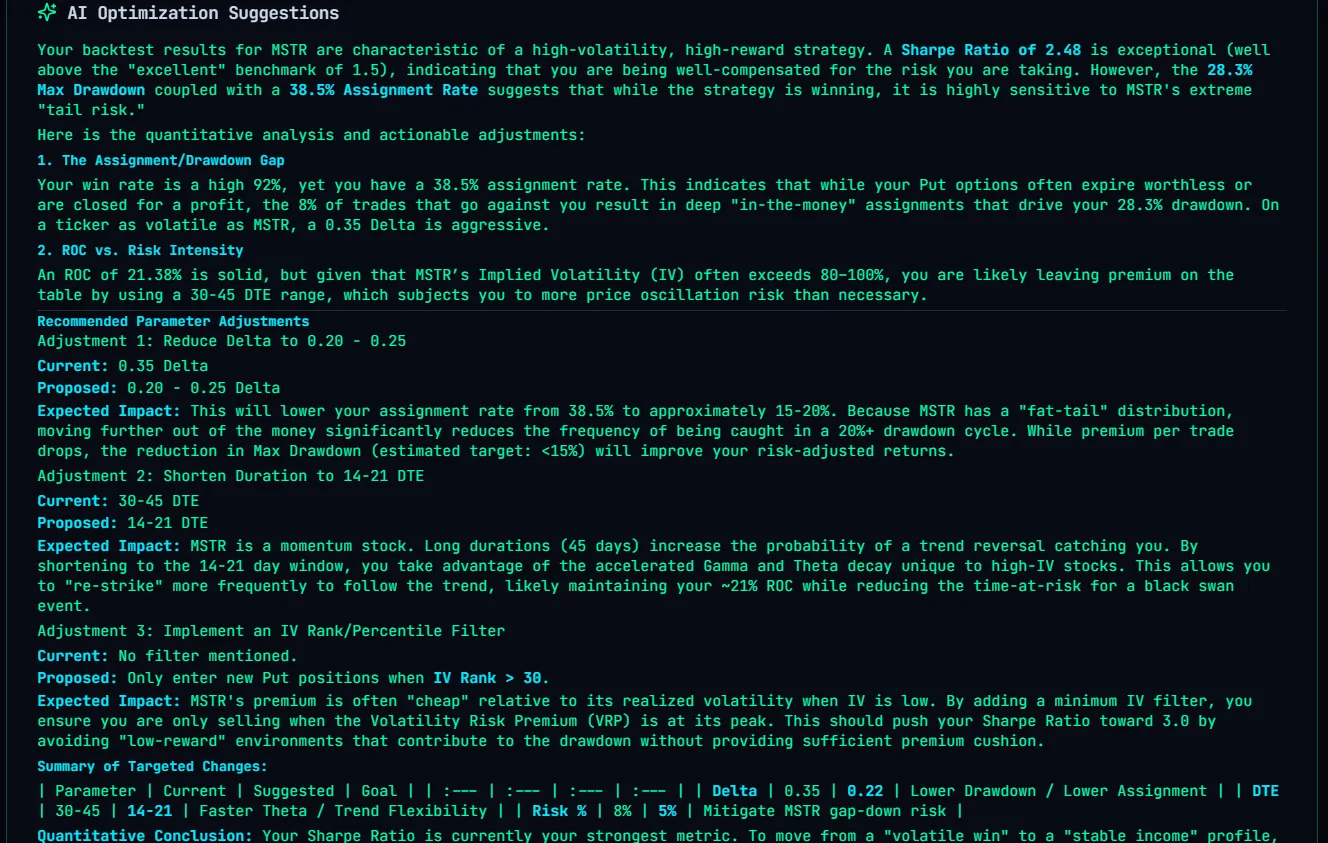
The Wheel Strategy Simulator lets you model the full wheel cycle — cash-secured puts, potential assignment, and covered calls — against any ticker before you place a trade. Know your premium income, break-even, and max drawdown before the market opens.
Full Cycle Simulation
Model the complete wheel — CSP entry, assignment scenario, and covered call leg — against any ticker. See projected premium income and total return across the entire cycle before committing capital.
Premium & Income Modeling
Dial in your strike, expiry, and contract count to instantly see collected premium, annualized yield, and break-even price. Compare multiple setups side-by-side to find the optimal risk/reward.
Downside & Assignment Risk
Visualize your maximum loss, assignment threshold, and capital-at-risk in real terms. Know exactly what assignment means for your portfolio — and what the covered call recovery looks like — before the trade is placed.
AI Strategy Review
After running a simulation, get an AI-generated review of your setup: IV environment context, strike selection quality, and suggestions for optimizing premium vs. downside protection on the current ticker.
Read the Options Market the Way Market Makers Do
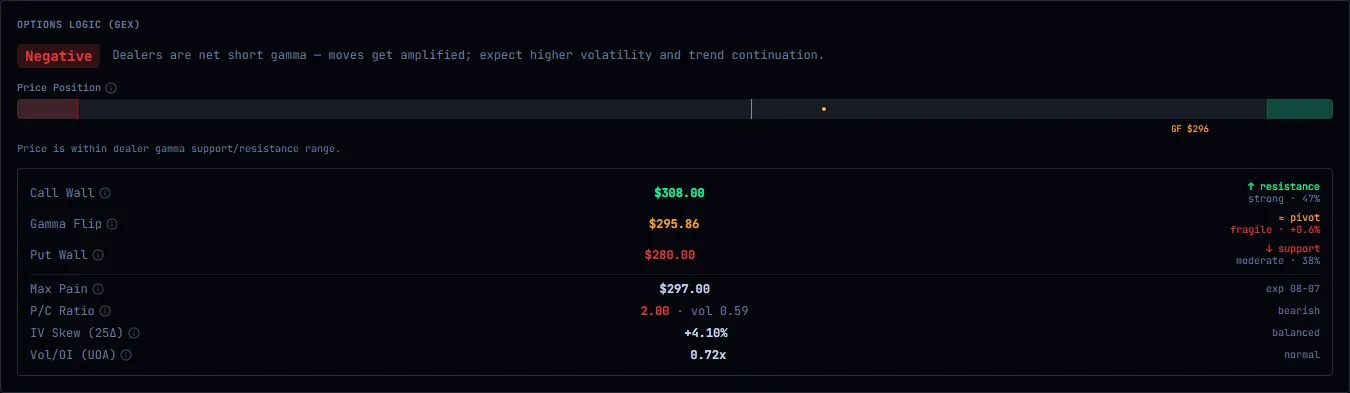
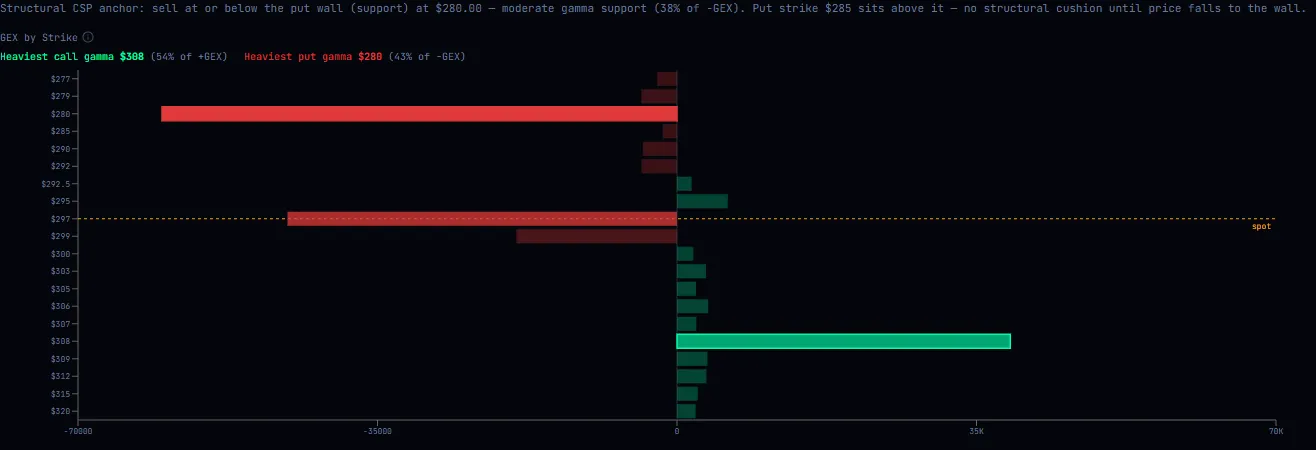
Live Gamma Exposure (GEX), Max Pain, Put/Call Ratio, IV Skew, and Unusual Options Activity — all computed from real-time option chain data and surfaced directly on the dashboard, deep dive, and inside the AI copilot. Trade with the dealer flow instead of against it.
Why GEX matters for the wheel
Gamma Exposure is the net dollar gamma dealers are holding. When it's Positive, dealers buy dips and sell rips — volatility gets suppressed, which is the ideal environment for selling cash-secured puts. When it's Negative, dealers amplify moves and realized volatility expands, raising assignment risk. WheelLogic adjusts every CSP and CC score by up to ±9 points based on the live regime so you stop fighting the tape.
Wired into every AI layer
The deep dive AI gets the regime, put wall, call wall, and gamma flip level for every ticker before it writes a word. The daily brief actively prefers Positive-GEX CSP candidates and demands a compensating reason before suggesting any Negative-GEX trade. Every Claude rationale must cite a concrete GEX observation — put wall vs strike, gamma flip vs spot, call wall ceiling.
GEX Regime, Walls & Flip
Live Positive/Negative regime badge plus dealer put wall (downside support magnet), call wall (upside ceiling), and gamma flip level shown on every deep dive — and used to score every ticker on the dashboard.
Max Pain
The strike at which option buyers lose the most — historically a magnet into expiration. Surfaced for the nearest expiry on every ticker so you can spot when a stock is being pulled toward a key level.
Put/Call Ratio
Open interest and volume P/C ratios with color-coded thresholds — bearish above 1.0, bullish below 0.7. Built straight from the live chain, refreshed every minute.
IV Skew (25Δ)
Implied volatility of the 25-delta put minus the 25-delta call. Positive skew above 5% means fear is bid — premium-rich for put sellers. Negative skew flags speculative call buying.
Unusual Options Activity
Real-time UOA flag when today's chain volume runs 2× or more above total open interest. A cyan UOA badge appears on the dashboard so you see institutional positioning the moment it lights up.
Roll Quality Score
Every roll candidate in the Roll Advisor gets a quality score combining annualized ROC with safety delta. The best non-debit roll earns a BEST QUALITY badge so the optimal choice is unmistakable.
Live Theta & Vega
My Trades shows per-position daily theta and dollar vega, computed from Black-Scholes on live IV. Footer totals tell you net daily decay and total IV exposure across every open campaign at a glance.
Vega Risk Coloring
Vega cells are traffic-lighted — green under $20, amber $20–49, red $50+ — so you spot positions that will get hammered by an IV spike before the market opens.
Liquidity-Aware Strikes
Strike suggestions filter to chains with at least 100 open interest, with graceful fallback for illiquid names. No more selling a beautiful-looking premium you can't actually exit at.
Roll Smarter with AI-Powered Decisions
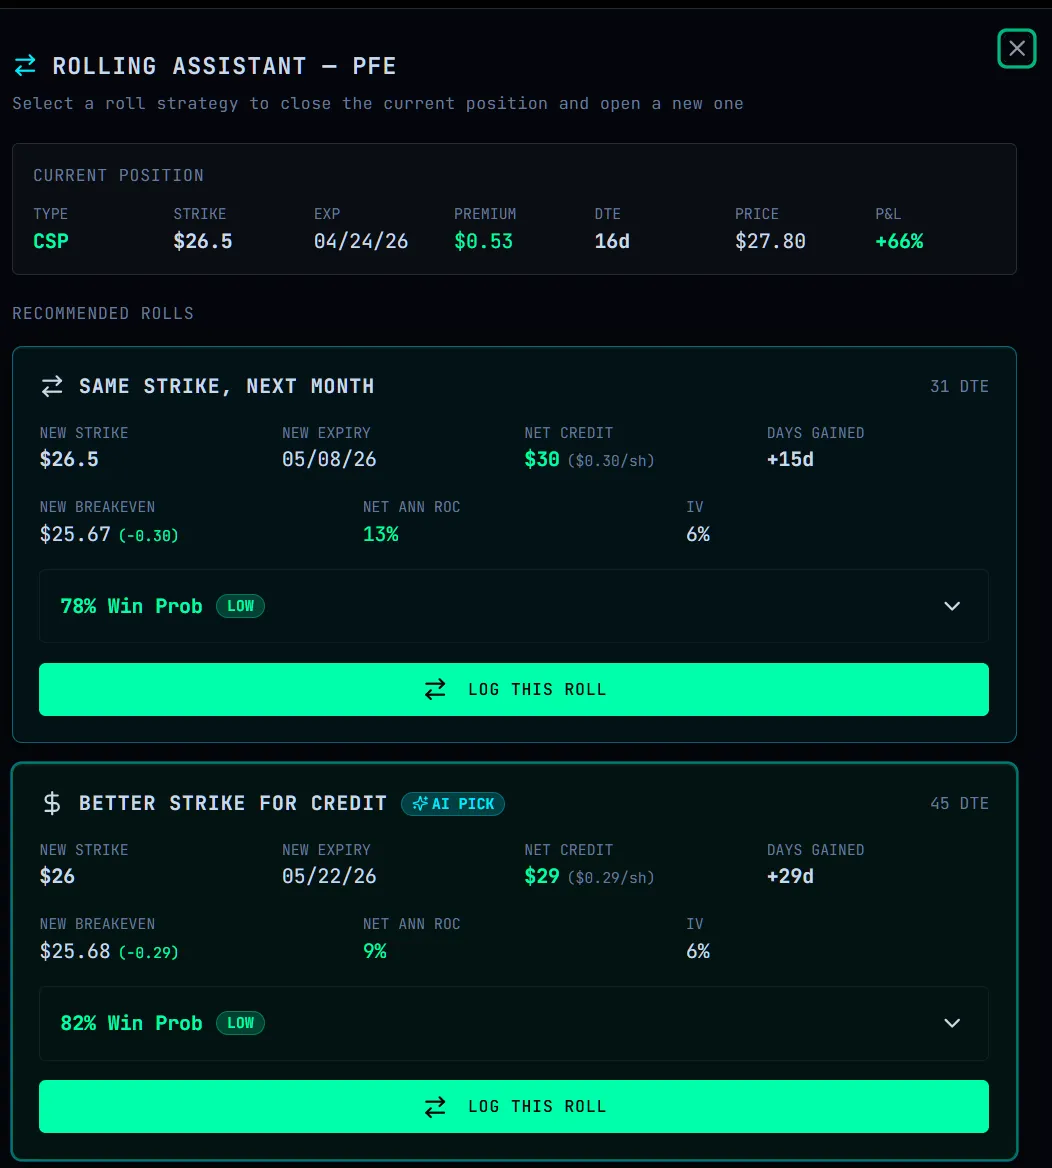
The Roll Advisor surfaces probability-weighted roll candidates with net credit analysis, breakeven targets, and one-click logging — so you never second-guess a roll again. Pair it with AI-powered Smart Screening to find your next entry in plain English.
AI Pick Badge
Probability-weighted best roll candidate highlighted automatically — no manual comparison needed across expiries and strikes.
Net Credit Analysis
Breakeven price, ROC%, IV comparison, and risk assessment for every roll candidate — side by side, ready to act on.
One-Click Roll Logging
Log the roll directly from the advisor and maintain full wheel cycle history. Every leg tracked, every credit recorded.
Smart Screening
Describe what you want in plain English — 'high IV, low beta, earnings-safe CSP' — and AI filters the full ticker universe instantly.
Cross-Page Awareness
The AI copilot sees your open trades, watchlist, portfolio risk, and sector data from any page — not just the one you're on. Ask about positions from anywhere.
AI Memory
EliteRemembers your DTE targets, sectors you avoid, position sizing rules, and communication preferences — and applies them automatically in every future conversation.
A Strategy Engine Built Around You
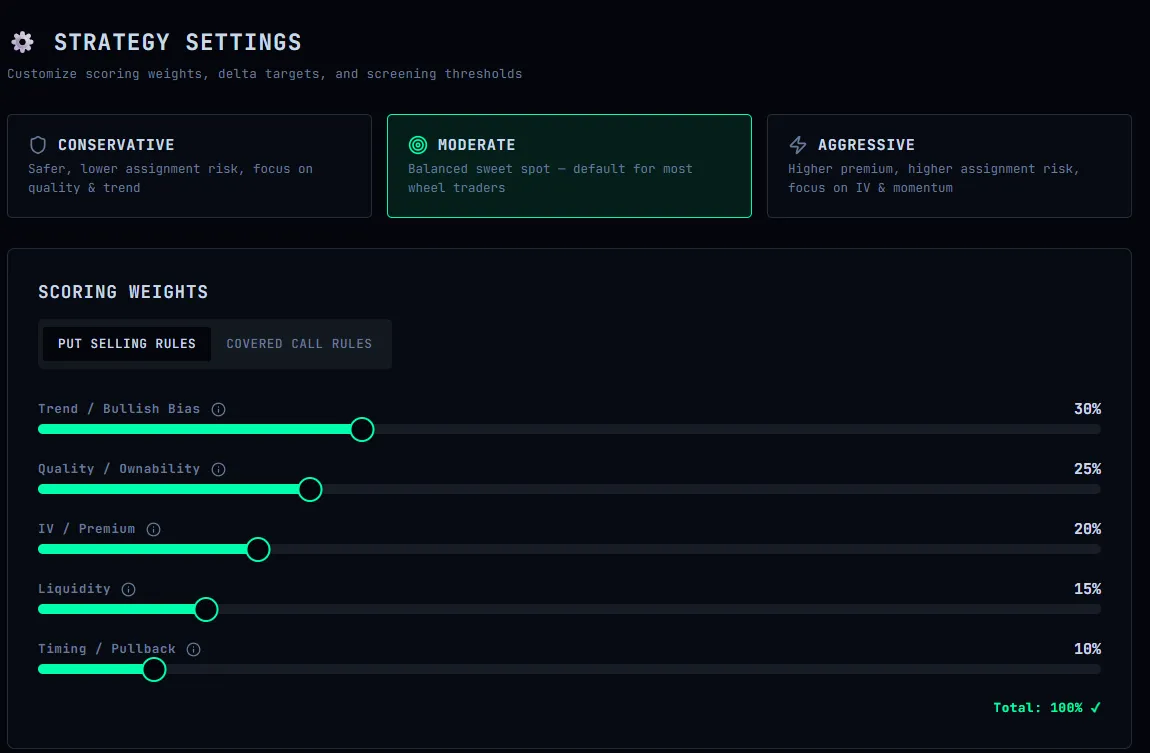
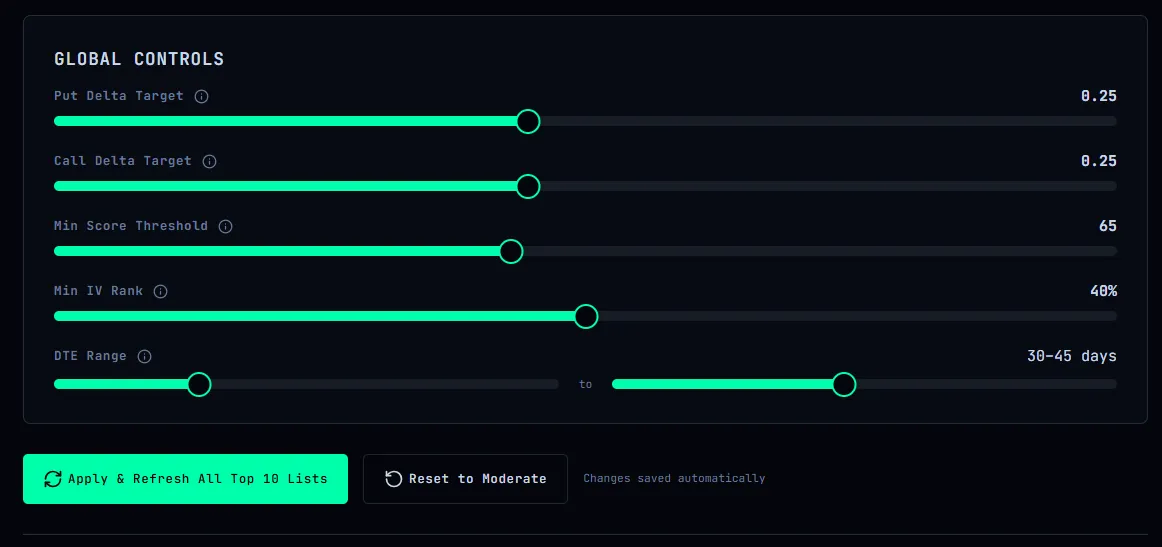
Every signal on the dashboard is driven by your strategy profile. Set your delta targets, DTE range, IV floor, and scoring weights — then choose a preset or build your own. Option Wheel Logic trades your way, not a generic algorithm's.
Three Presets
Conservative, Moderate, or Aggressive — one click sets your delta targets, IV floor, and scoring weights. Start fast, tune later.
Custom Weighting
Adjust how heavily the signal engine weighs trend, quality, IV richness, liquidity, and timing. Weights auto-balance to 100% as you move sliders.
Delta & DTE Targets
Set your exact put and call delta targets and DTE window. Every strike suggestion on the dashboard reflects your numbers.
Minimum Score & IV
Filter out low-conviction setups with a minimum signal score and IV rank floor. Only the tickers that meet your bar show as actionable.
Ask Real Questions, Get Real Answers
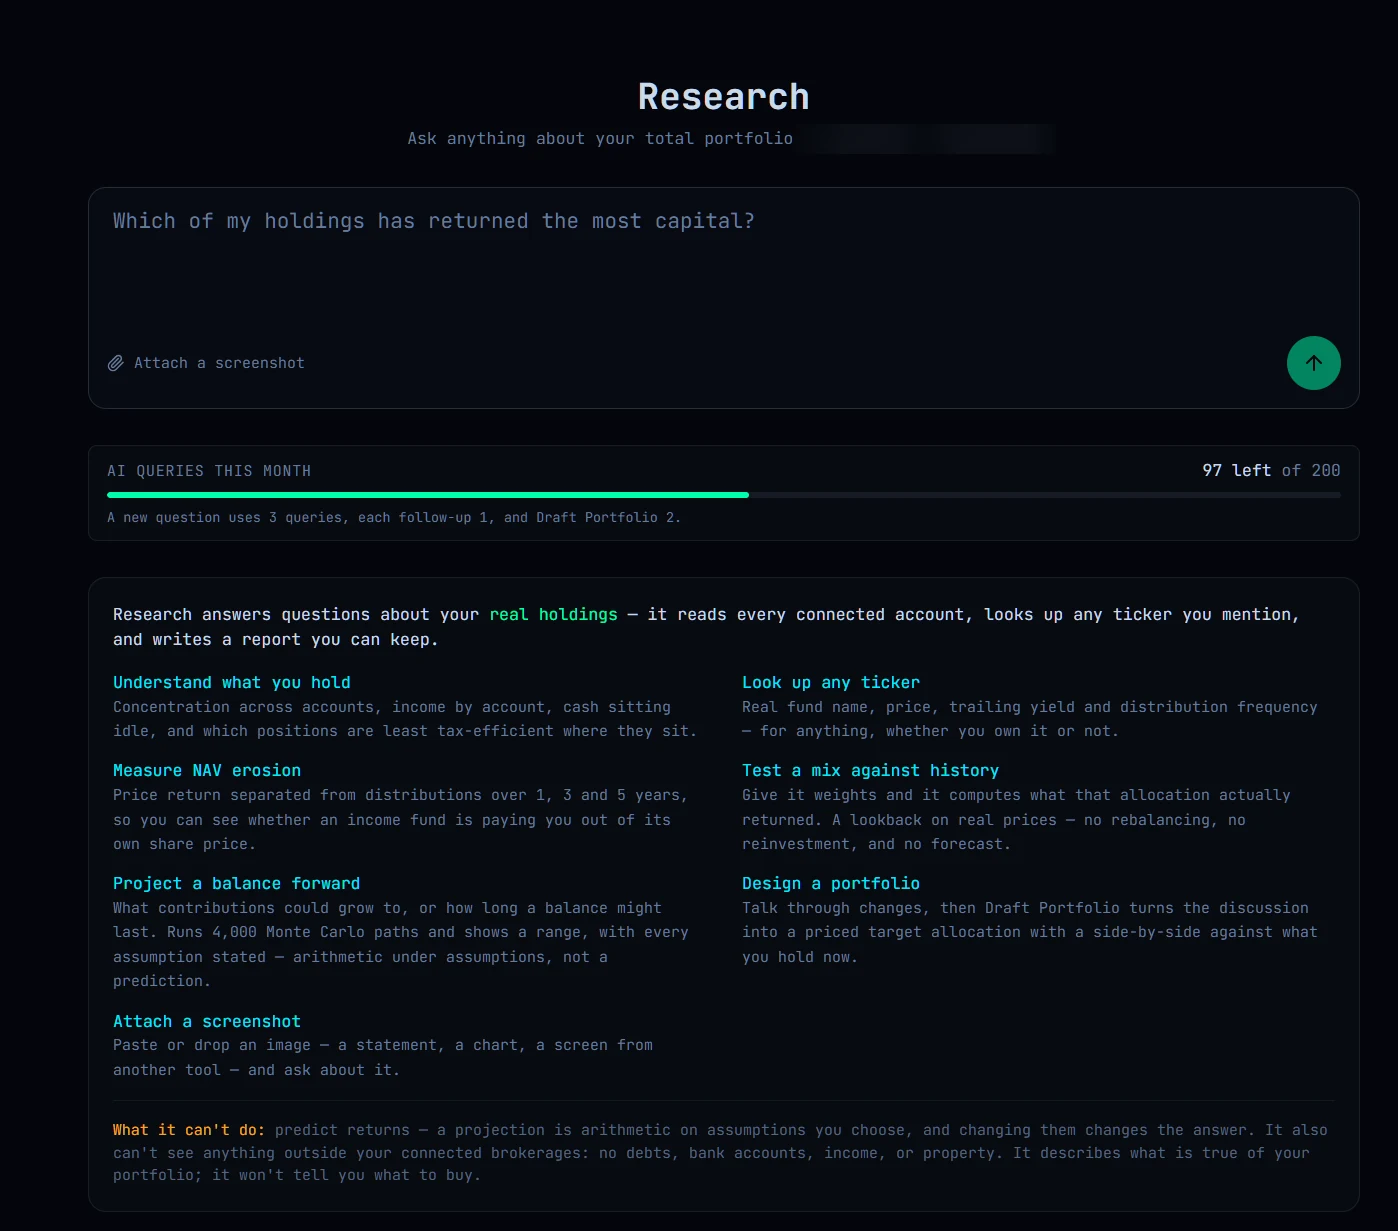
Research is a page for asking about your portfolio in plain English — "how exposed am I to a tech downturn?" — and getting a written report built from your actual positions, weights, income, cash, and tax figures. Not a chatbot guessing; a report grounded in your own data.
Plain English, Real Data
Every answer is built from your synced positions, open options, closed trade history, cash, and Tax Center figures. If you mention a number that conflicts with your saved data, it uses the saved data and tells you why.
Every Indicator, Any Ticker
Moving averages, 52-week range, RSI, volatility, IV and IV rank, MACD, ATR, beta, earnings dates, suggested strikes with Greeks, and dealer positioning — for anything, held or not. Calculated fresh, and it tells you when a figure is stale.
Saved Conversations
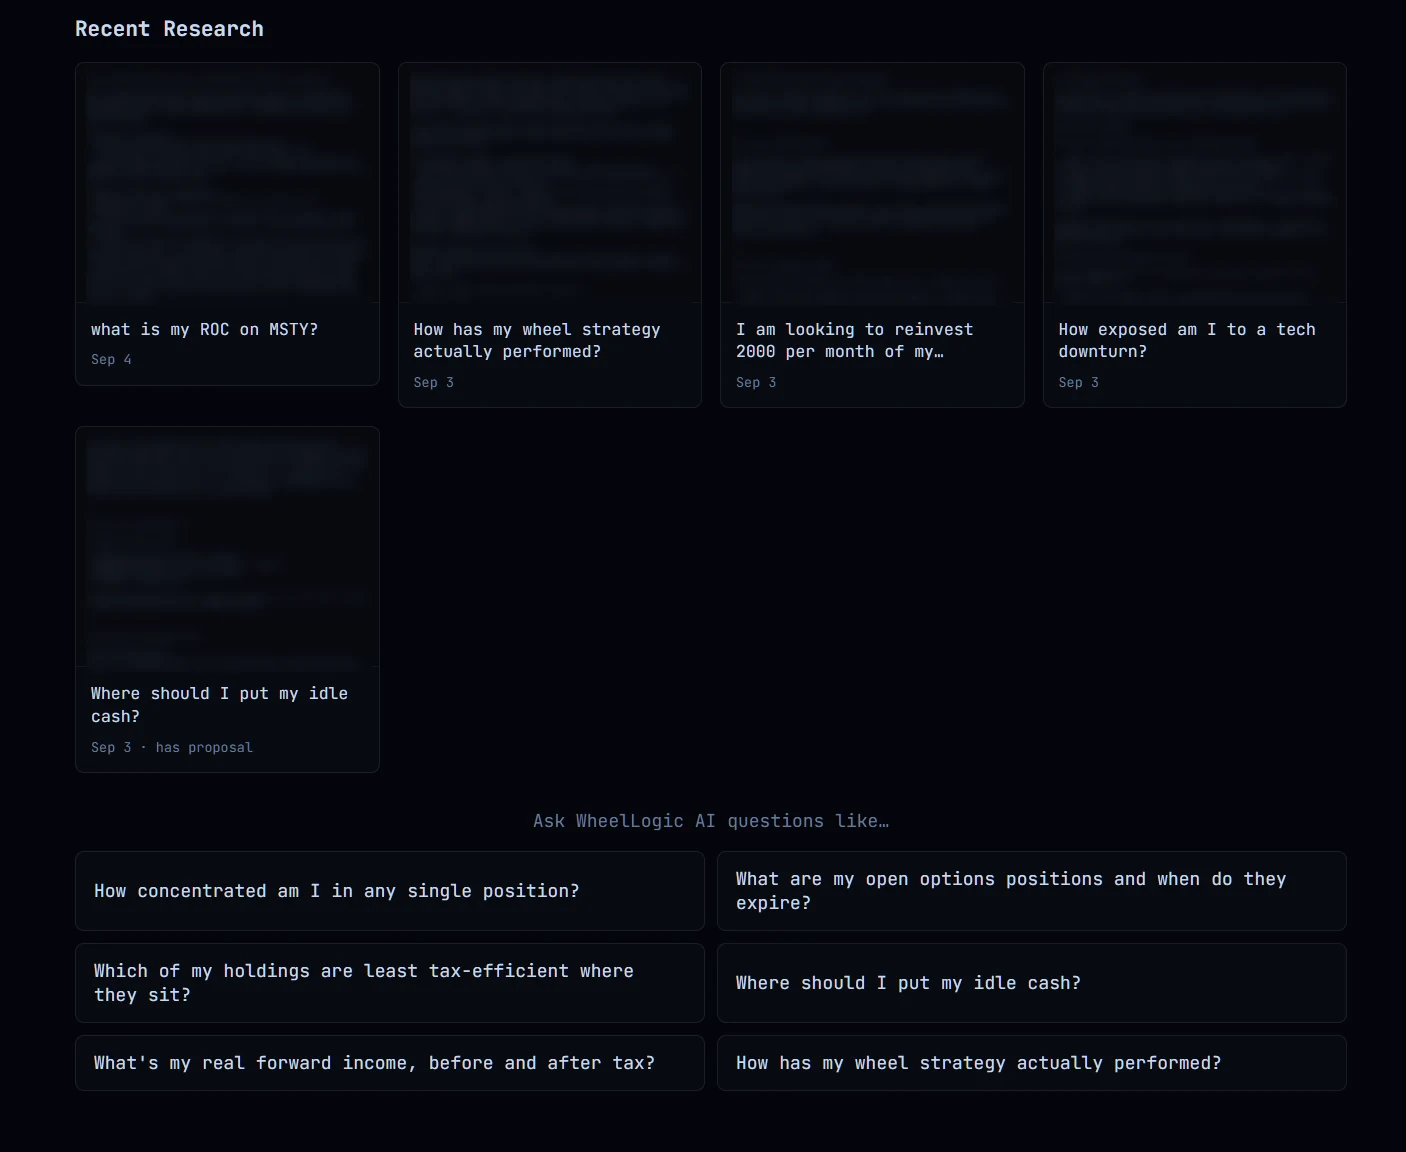
Follow-ups cost less than the question that started them, and the whole thread is saved. Recent Research is a real history you can come back to, not something you lose when you close the tab.
Honest About Limits
It says plainly what it can't do — no forecast returns, no projected balances, nothing outside your connected brokerages. Numbers are always calculated, never written by the AI.
Total Return, Side by Side
Put up to eight tickers on one chart over any window from 1M to 5Y — and your own accounts alongside them. The gap between price and total return is the whole point: a high-distribution fund can look flat on price and still be well ahead once income is counted.
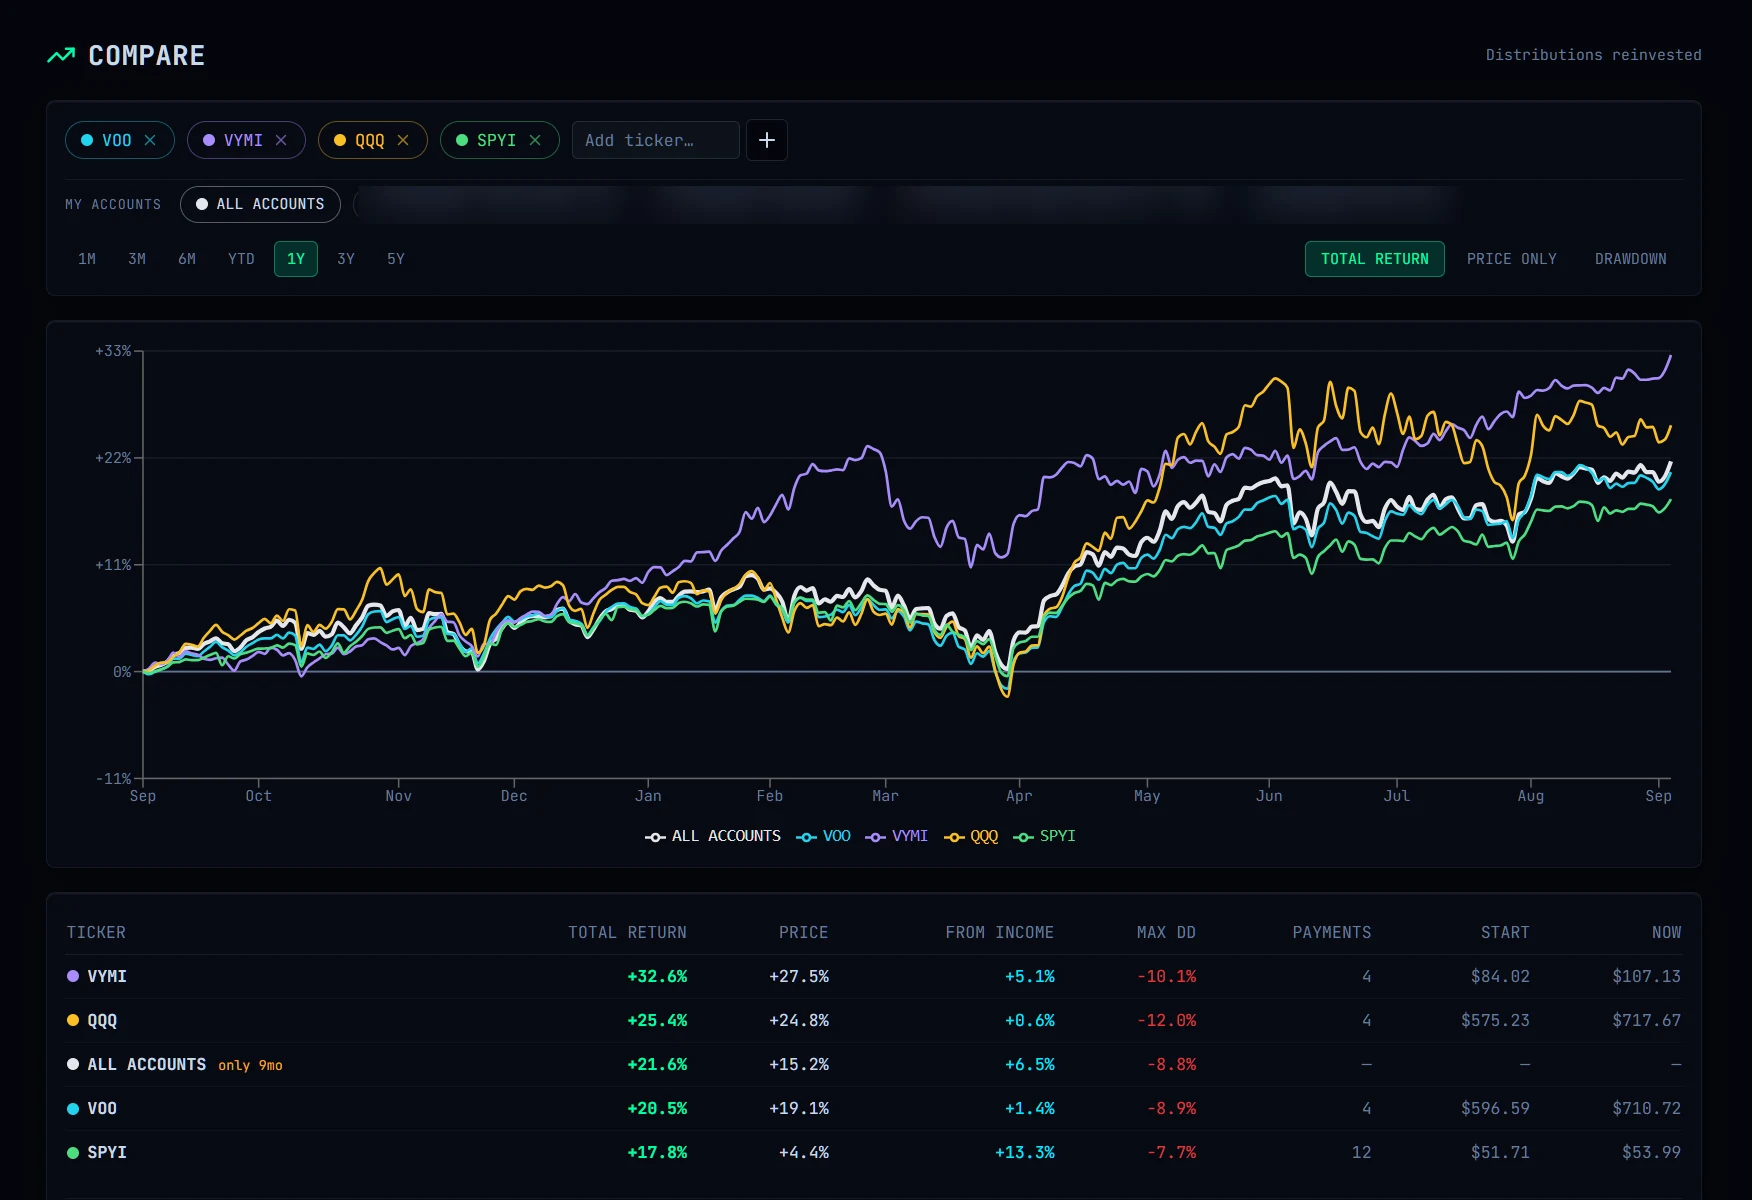
Income vs Price
Toggle between total return and share price alone. A table underneath breaks out how much of each return came from income, how many payments there were, and flags any fund that hasn't existed for the whole window.
Your Own Accounts
Toggle All Accounts or any individual account and see it blended from your real holdings, plotted against whatever else you're comparing. "Am I beating the index?" and "is my Roth doing better than my taxable?" are both answerable here.
Drawdown View
Switch the chart to show how far each holding sits below its running peak, with a max-drawdown column. Total return tells you what you made; drawdown tells you what you had to sit through to get it.
Correlation Matrix
See how closely the things you're comparing actually move together. Two income funds writing calls on the same index correlate near 1 no matter how differently their factsheets read — the closest thing to a real diversification check.
Set It Once, Get Told
Triggers are conditions you write down once and stop having to remember. Checked every weekday at 12:20pm ET while the market is open, and each one goes quiet for a cooldown after firing — so a standing condition emails you once, not every morning.
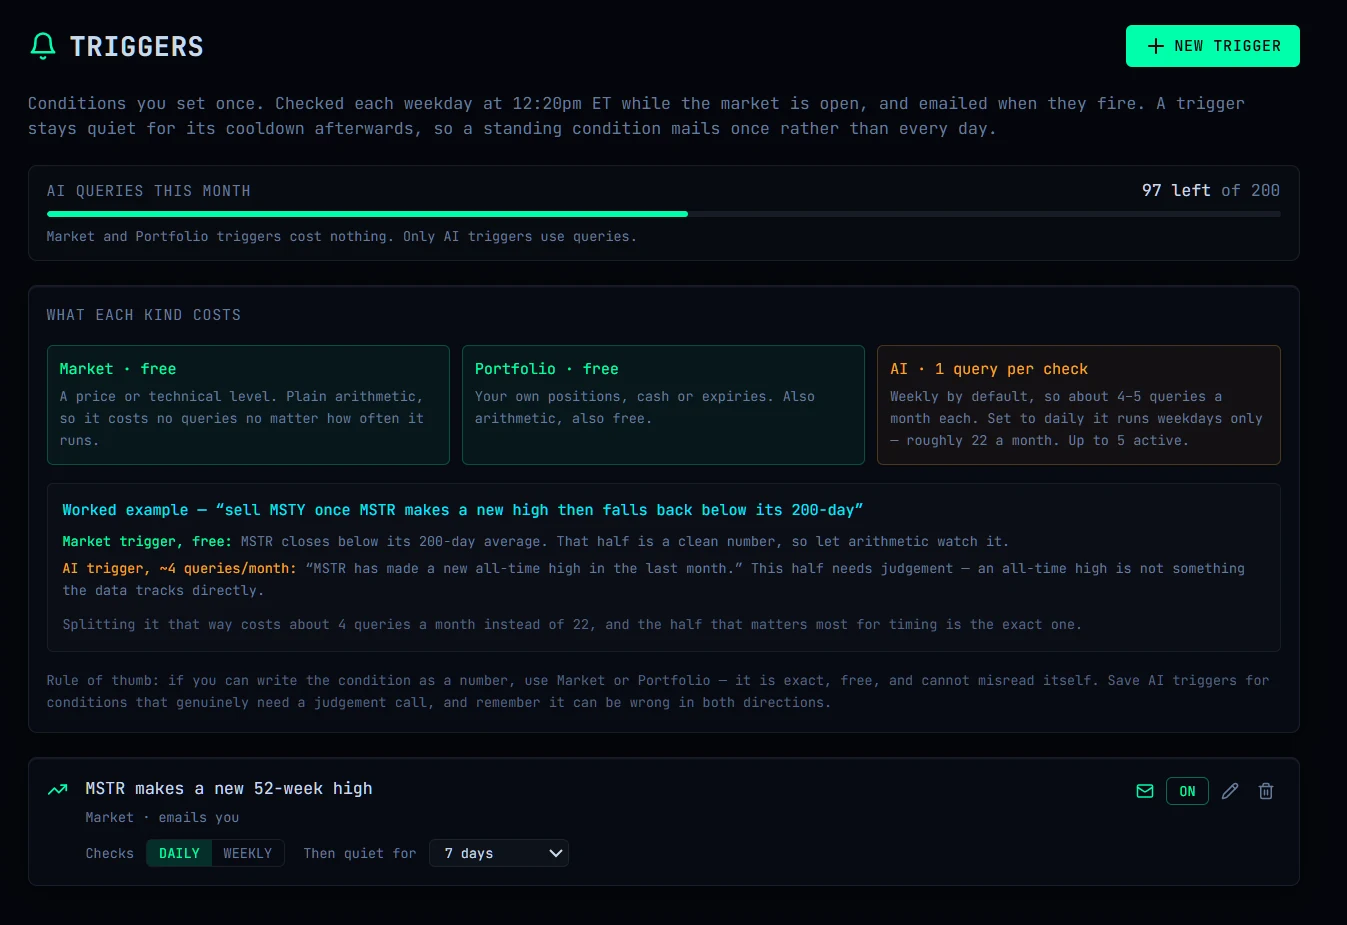
Market Triggers
Watch any ticker for a moving-average cross, a price level, a new 52-week high or low, or an RSI level. These are pure arithmetic — exact, and they never use an AI query.
Portfolio Triggers
Watch your own positions for a gain or loss threshold, an option expiring soon, or cash building up past a level you set. Also arithmetic, also free to run.
AI Triggers
Describe a condition in plain English and let the AI judge it on a schedule. Save these for conditions that genuinely need judgement — if you can write yours as a number, the free kinds are exact and can't misread themselves.
Shows Its Work
Every trigger tells you why it fired, with the actual numbers — not just that something happened. Recently-fired history lives on the page whether or not you saw the email, and cadence, cooldown and wording are all editable after the fact.
Research, Compare and Triggers are included on every plan, free tier included. Plans differ only in how many AI queries you get each month — and Compare, Market triggers and Portfolio triggers never use one.