We use cookies to improve your experience and analyze site usage. Privacy Policy
Dividend Income. Tracked Automatically.
Combine wheel premium income with dividend cash flow — projected, tracked, and visualized in one portfolio view.
Your Dividend Portfolio, All in One View.
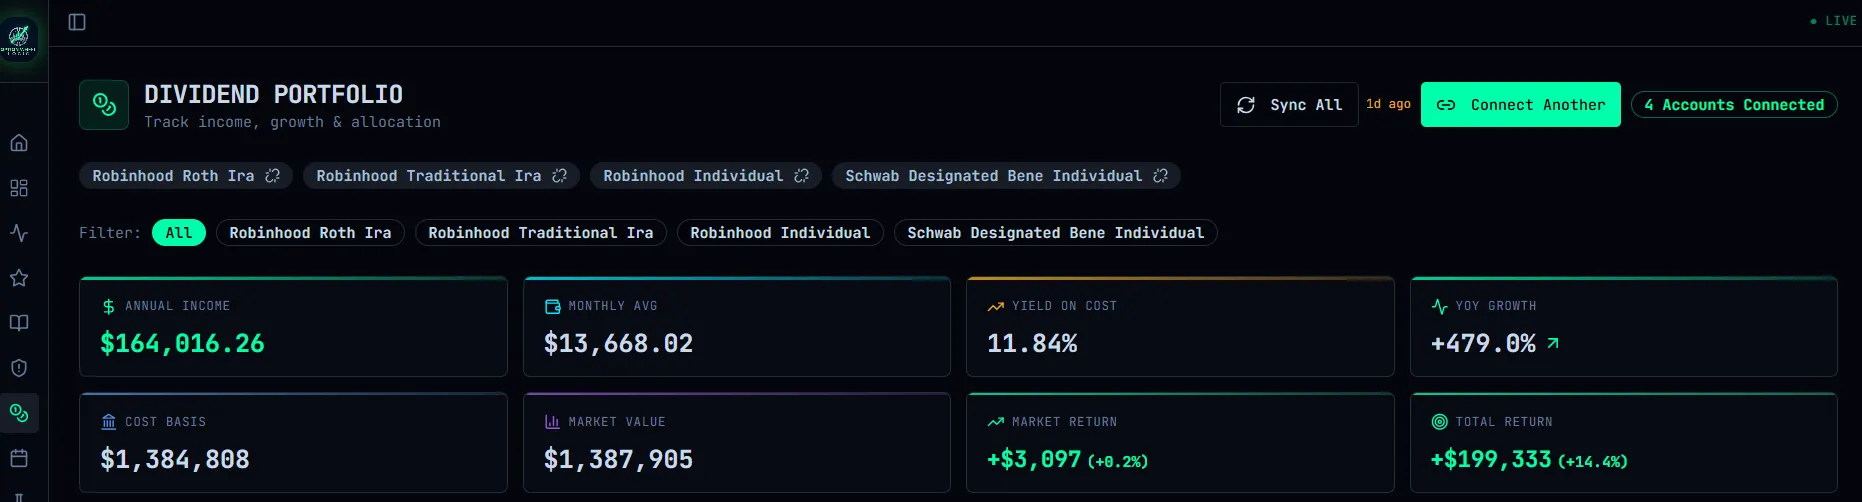
Track income, growth, allocation, and upcoming payments, auto-synced from your brokerage on Elite.
Income Projections
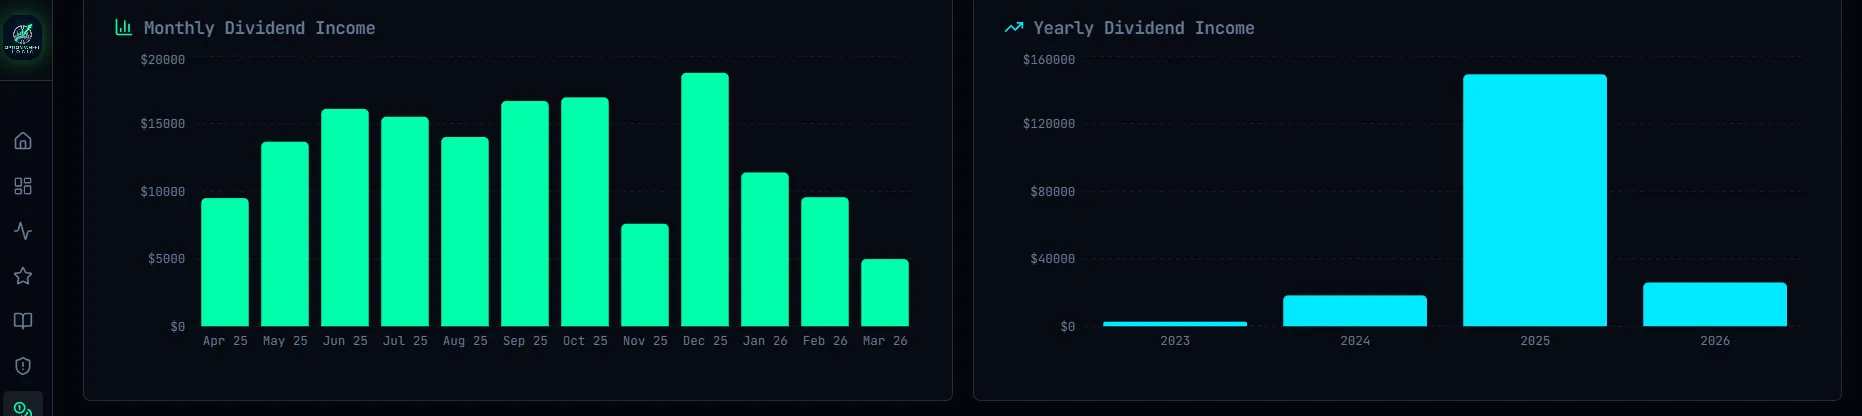
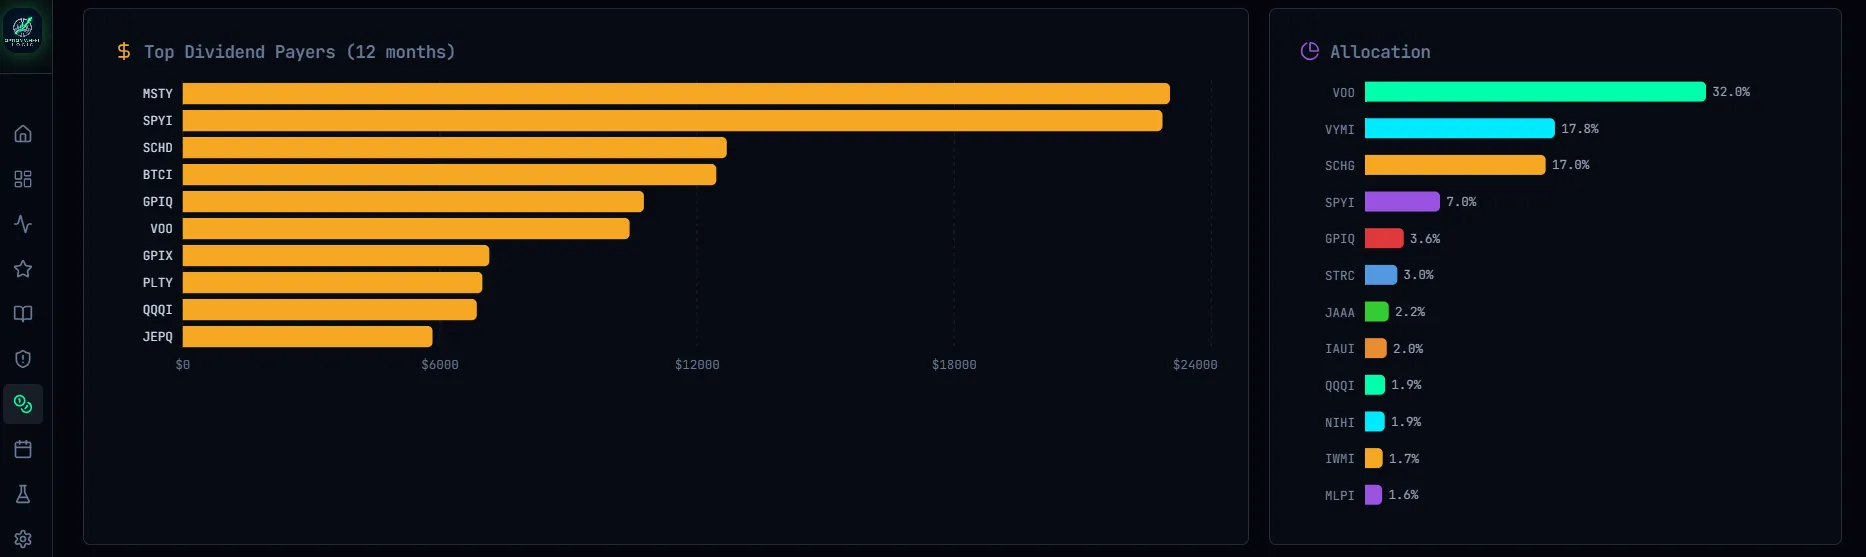
Projected annual dividend income across your portfolio, broken down by ticker and payment frequency.
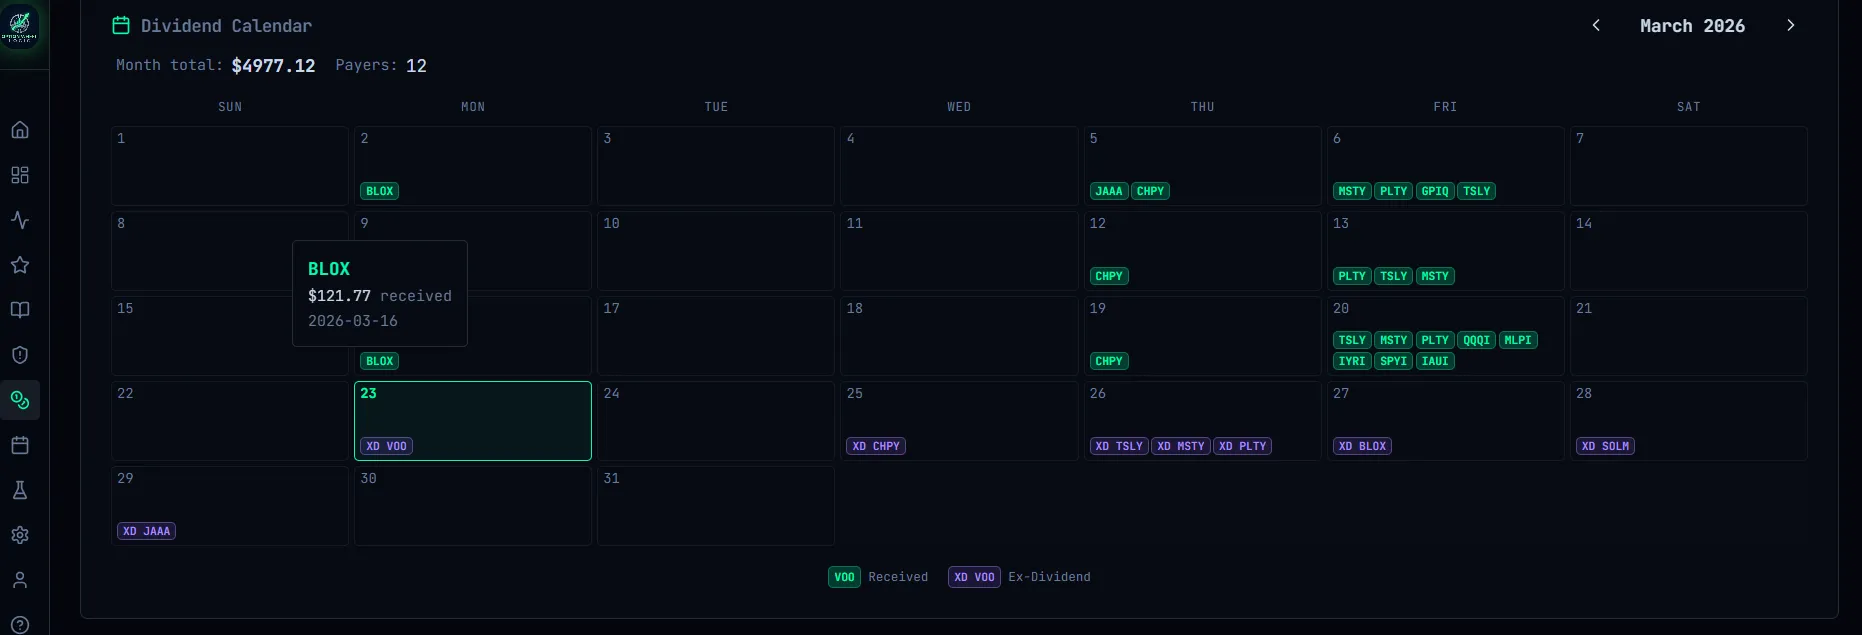
Ex-Date Calendar
Month/year heatmap with received payments and upcoming ex-dividend dates. Never miss a payout again.
Dividend Heatmap
Month-by-year grid showing historical income — spot seasonal patterns and gaps at a glance.
DRIP Simulation
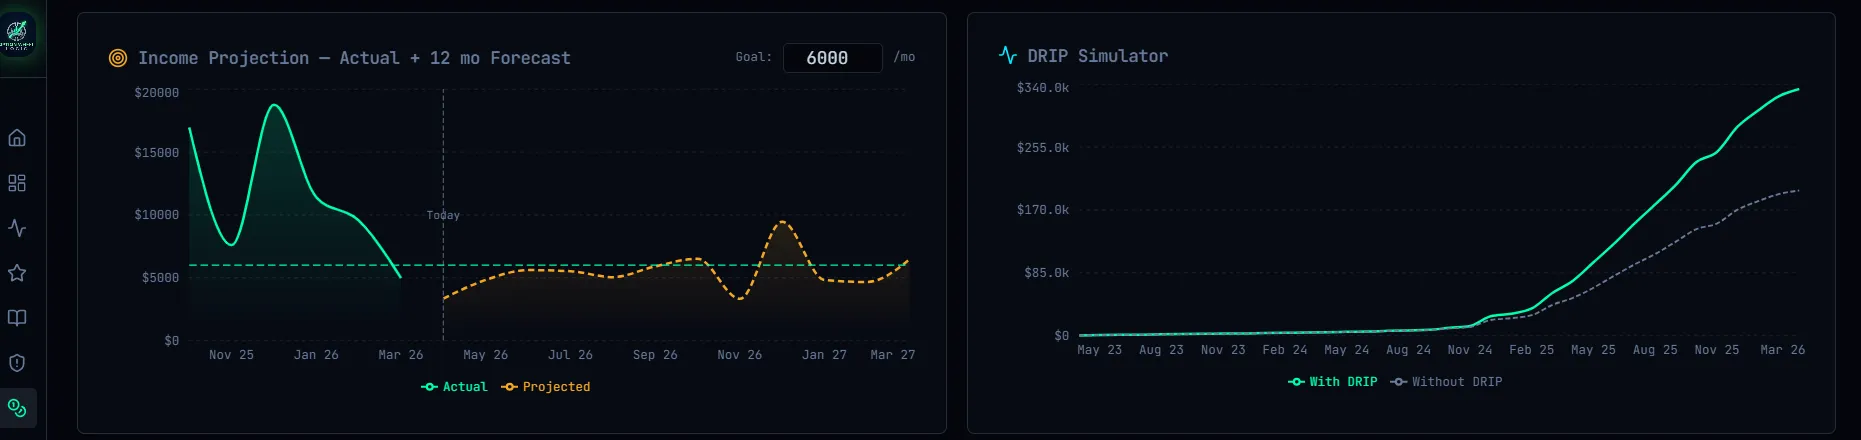
Model dividend reinvestment growth and see how compounding accelerates your income trajectory.
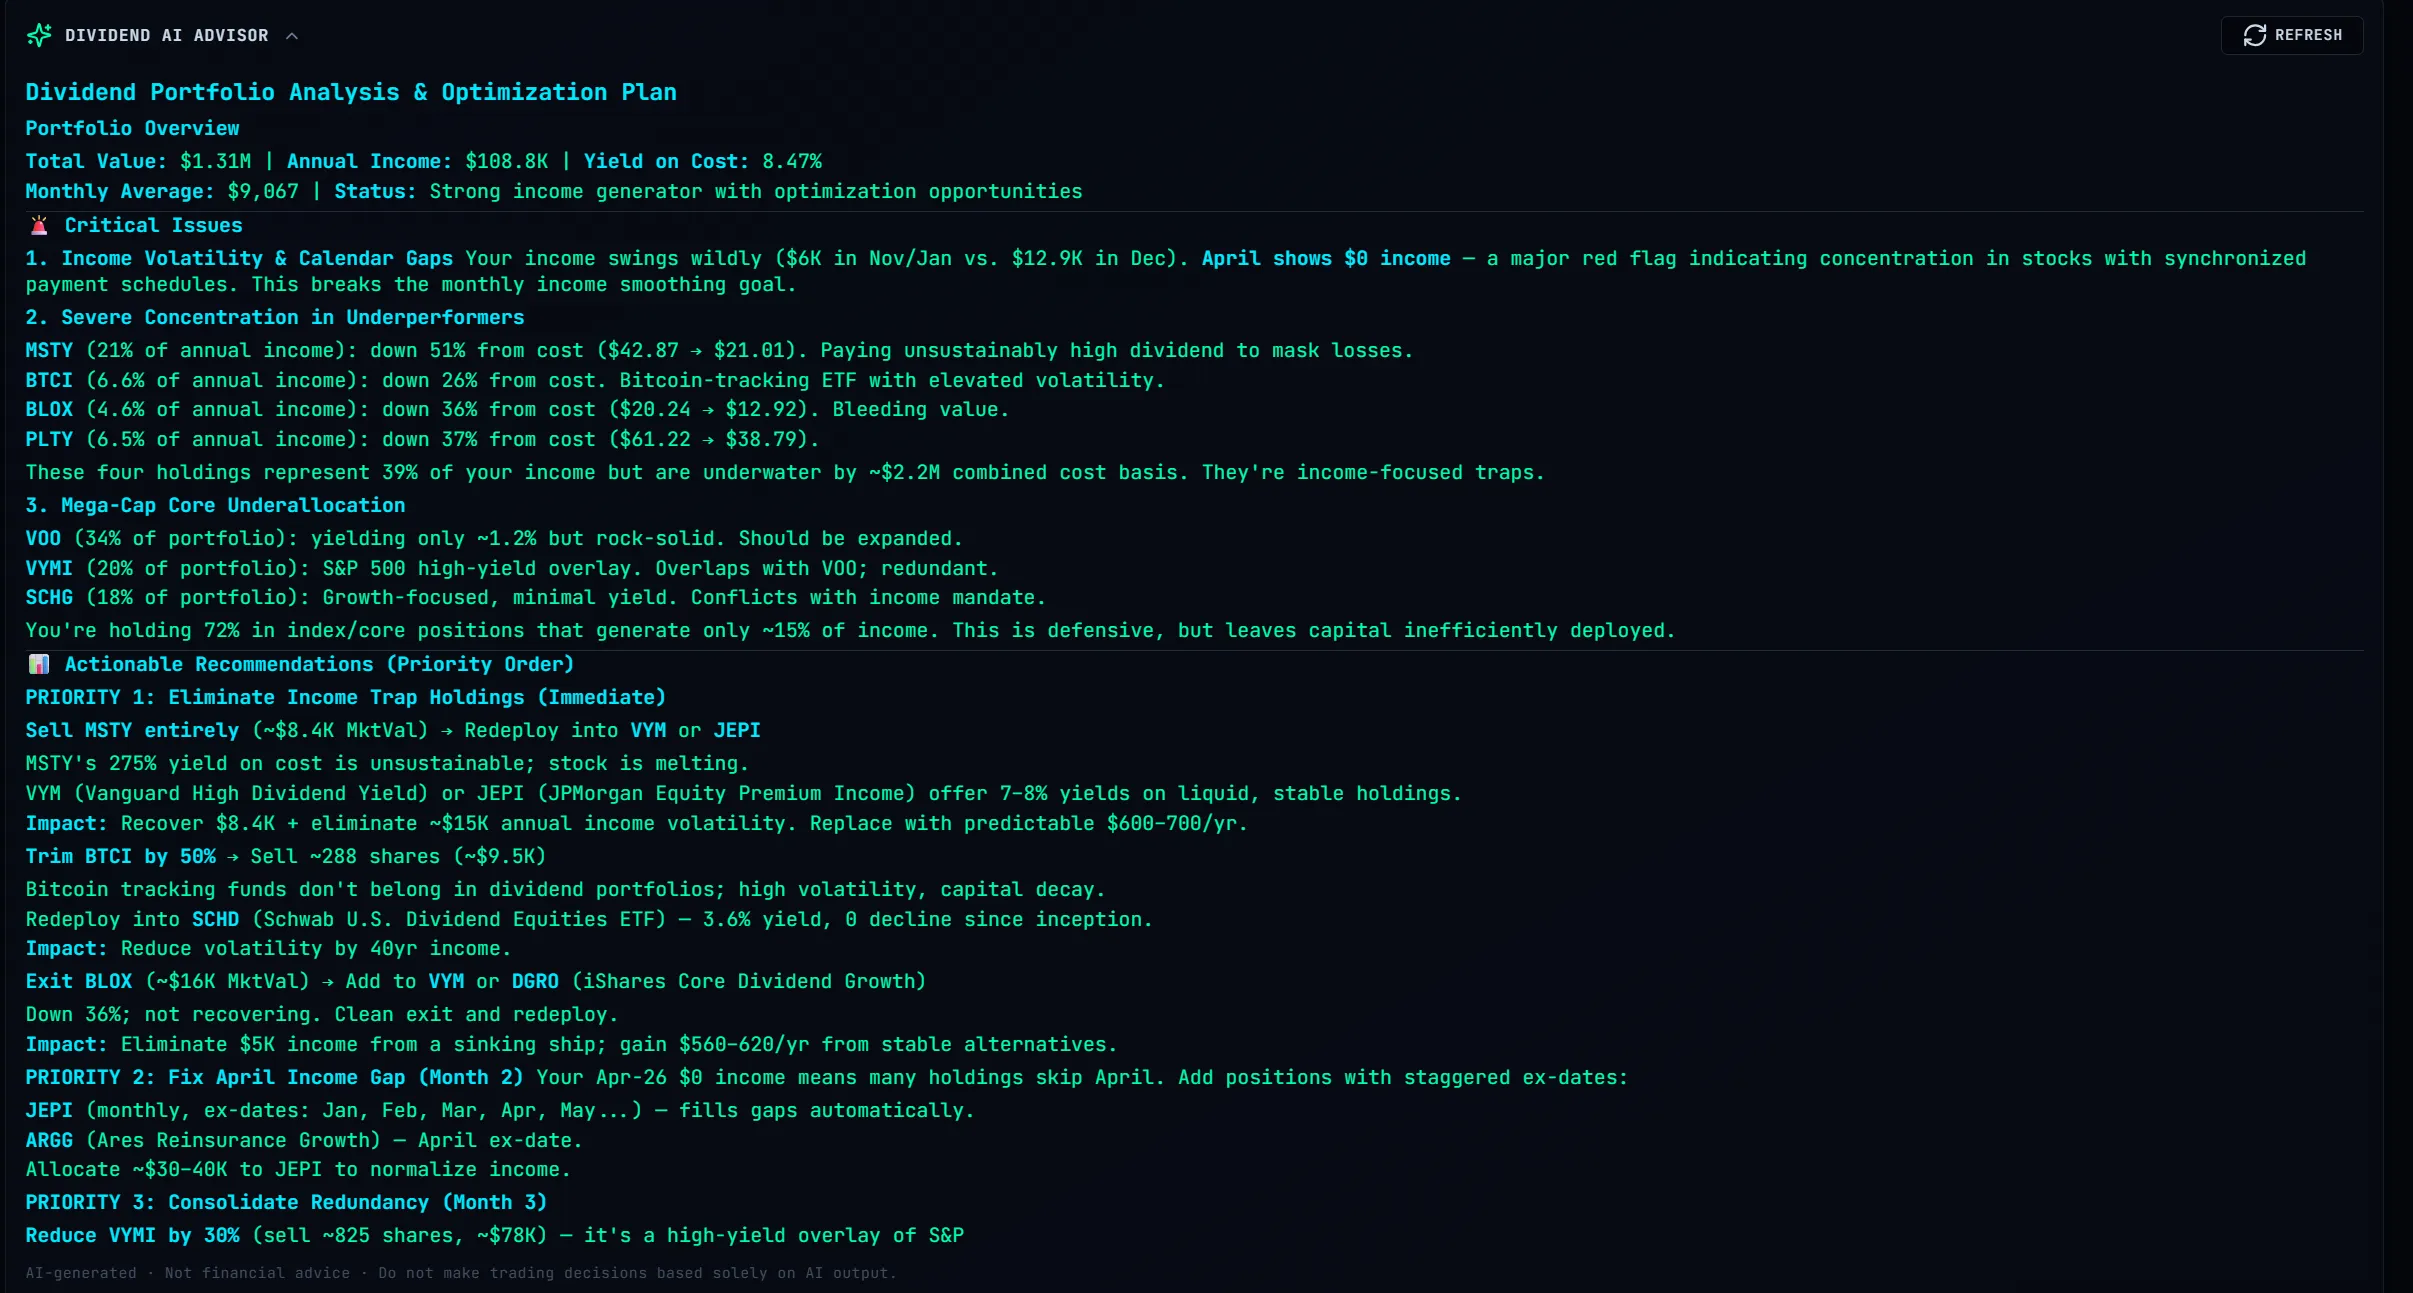
AI Dividend Advisor
AI analyzes your holdings and generates a personalized dividend strategy briefing on demand. WheelLogic AI has full dividend portfolio context on this page — ask it anything about your income strategy.
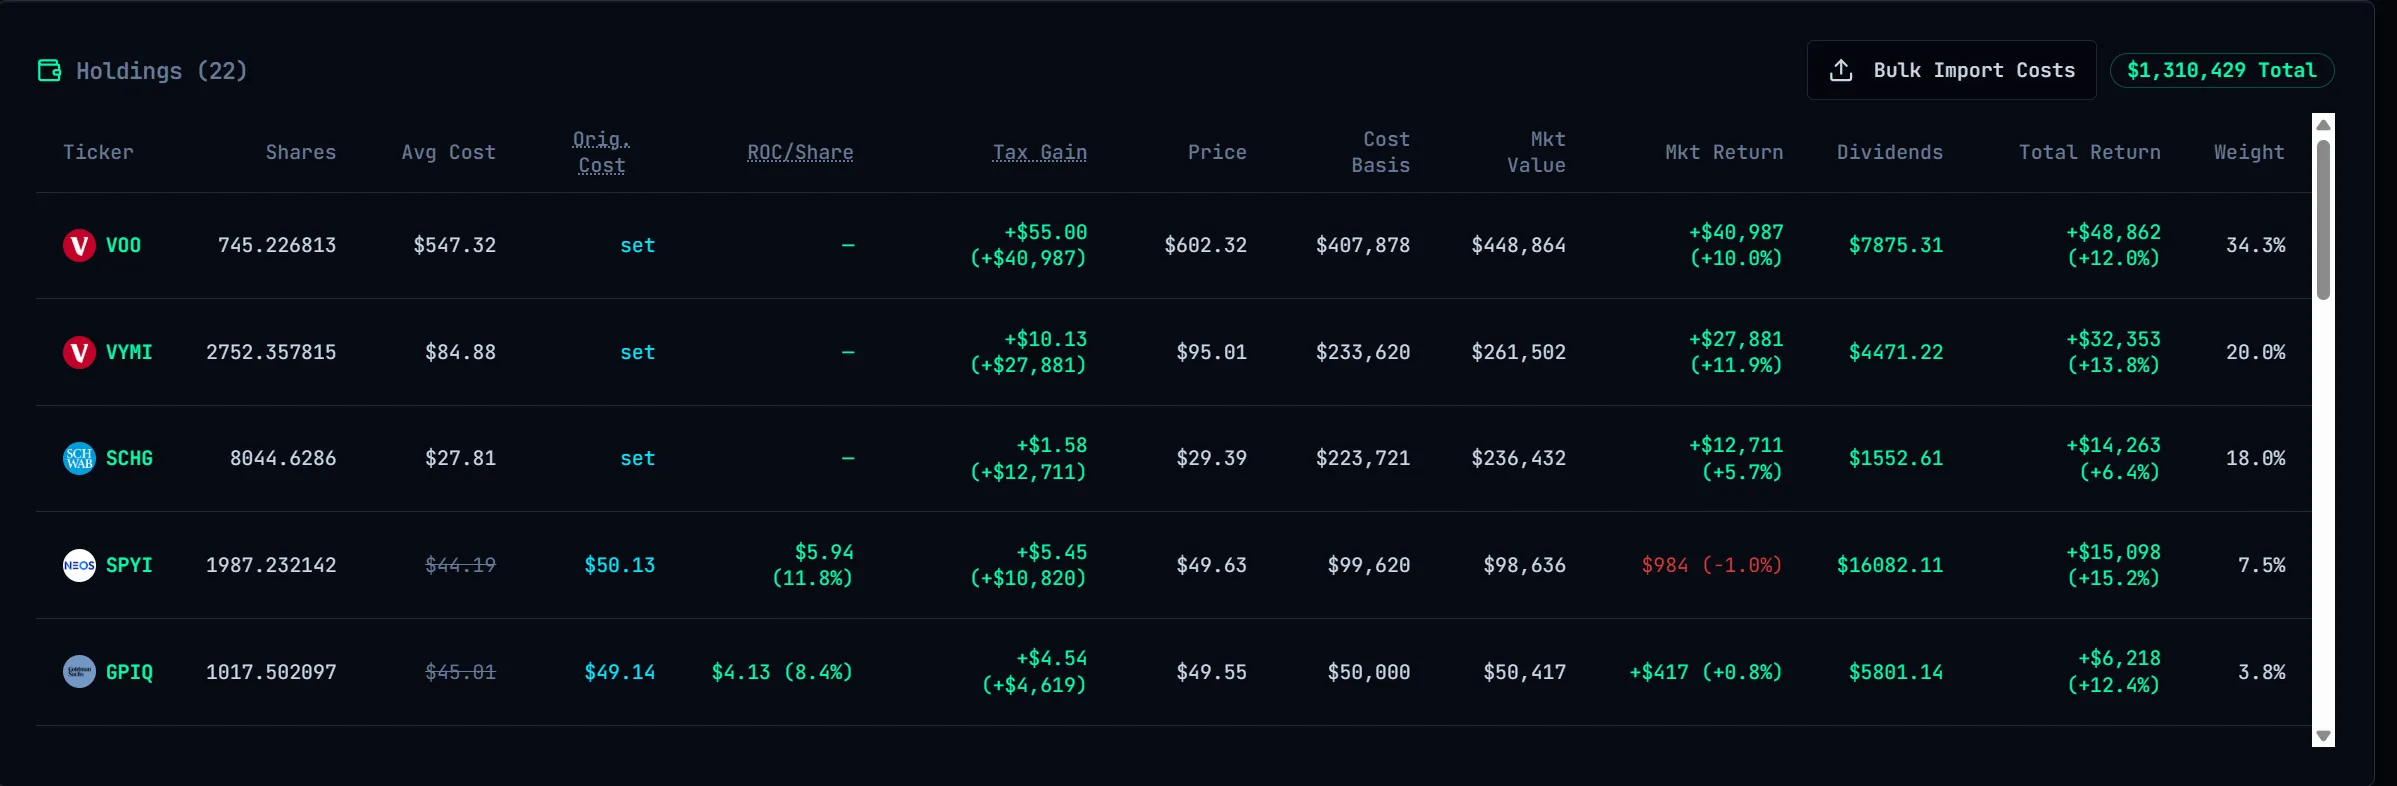
Holdings & Cost Basis
Track every position with original cost, average cost, ROC per share, unrealized gain, and dividend yield.
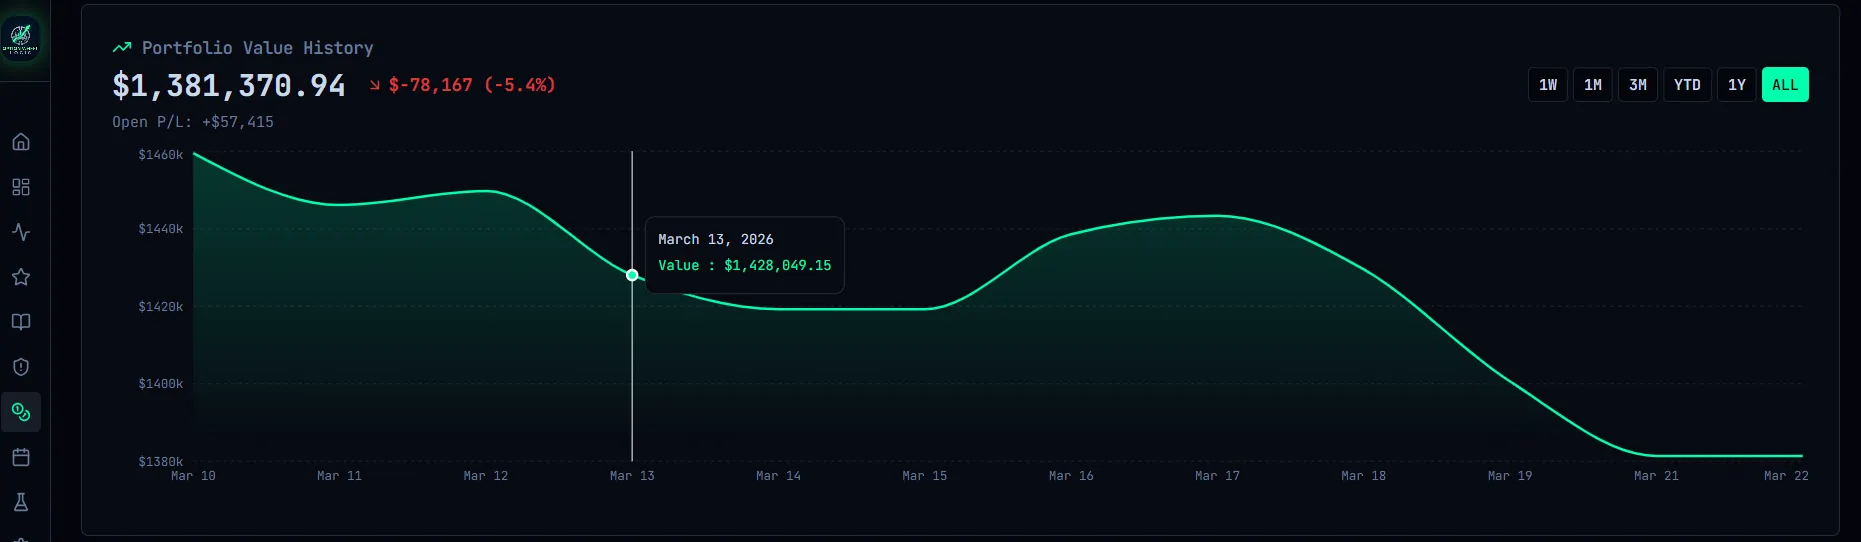
Portfolio Value History
Visualize total portfolio value vs. cost basis over time with 1W/1M/3M/YTD/1Y range filters.
Allocation View
Sector and ticker allocation charts showing where your dividend income is concentrated.
Smart Income Forecasting. Based on Your History.
The projection chart learns your seasonal dividend patterns — showing you exactly which months pay more and building a 12-month forward forecast from real history.
Seasonal Pattern Detection
Each calendar month is averaged across all historical years, naturally reflecting quarterly payment bumps instead of a flat estimate.
Actual + Projected View
Last 6 months of real income (solid) alongside a 12-month seasonal forecast (dashed) — with a Today marker at the transition.
Income Goal Tracking
Set a monthly income target and see how your projected dividend income tracks against it month by month.
Tax Center. Every Dollar Accounted For.
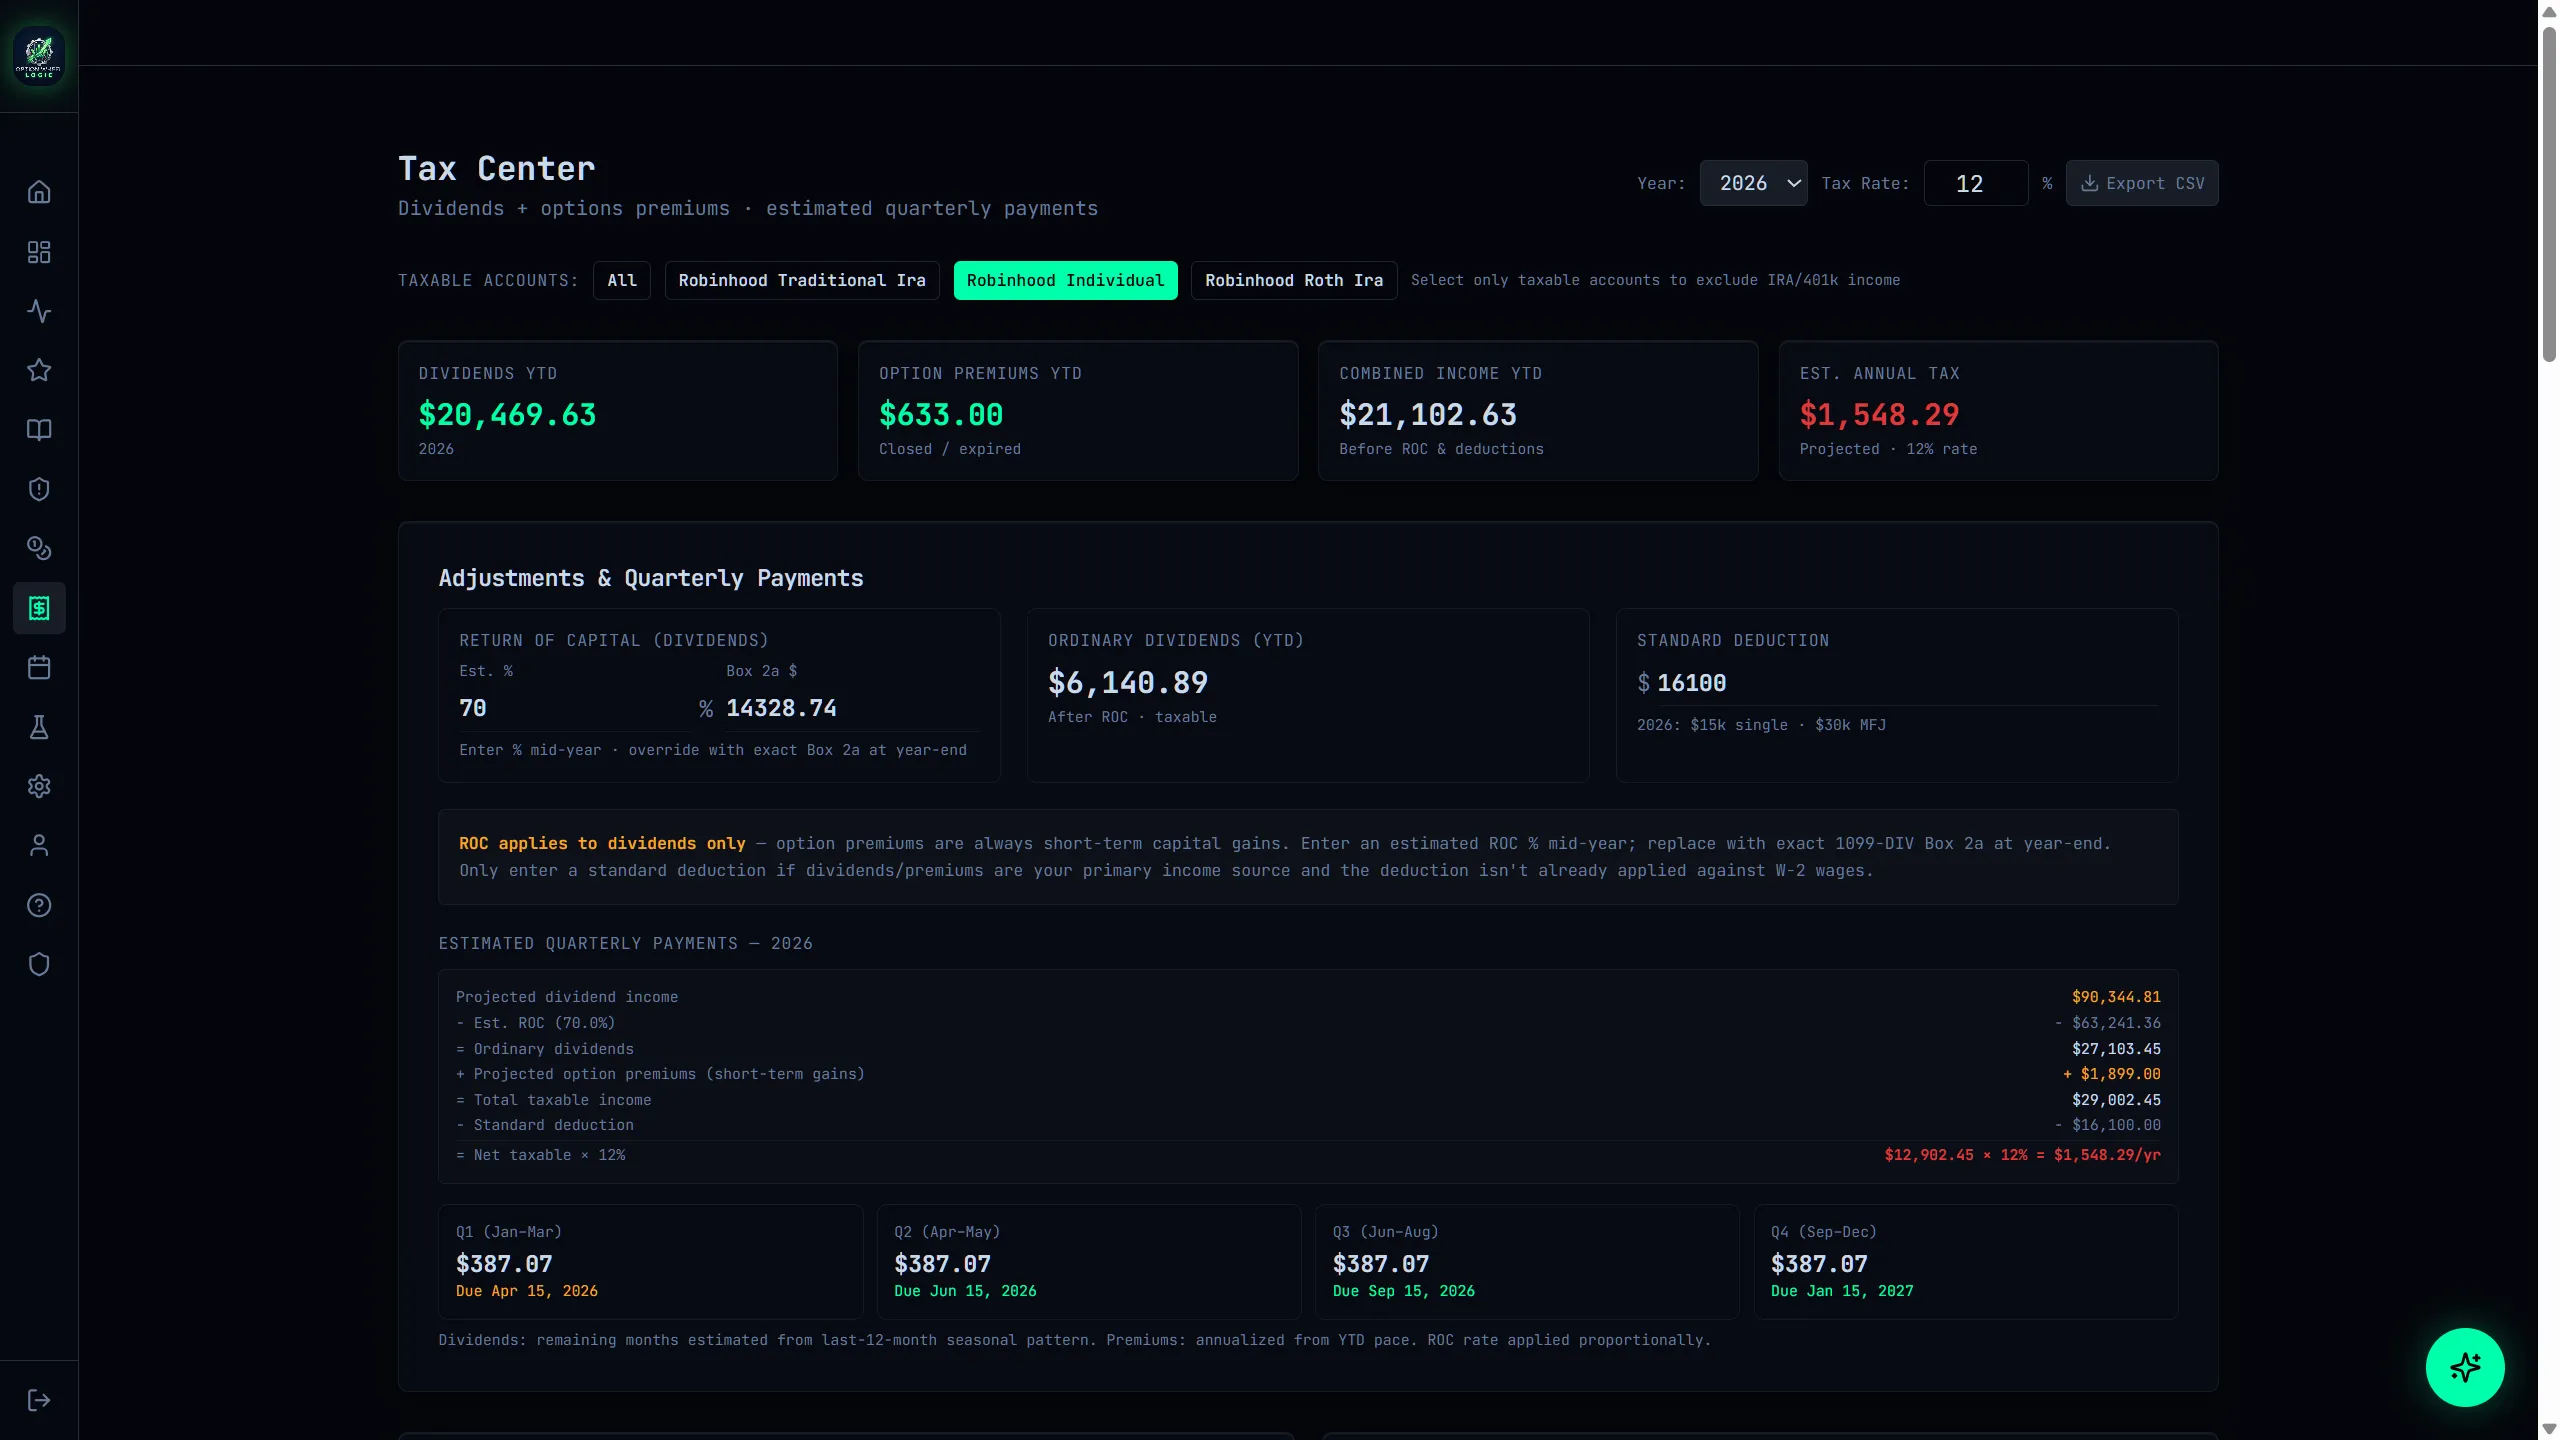
The only wheel strategy tax tool that combines dividend income and options premium income in one place — with projected quarterly IRS payments, ROC adjustments, and a full math breakdown so you're never caught off guard.
Combined Income View
Dividend income and closed/expired option premiums shown side by side — with per-ticker breakdowns for both streams and a combined total.
Projected Quarterly Payments
Full-year projection using seasonal dividend patterns + annualized premium pace. Step-by-step math shows exactly how each payment is calculated.
ROC Rate Estimation
Enter your fund's known ROC % mid-year and the dollar amount auto-computes from current dividends. Override with the exact 1099-DIV Box 2a at year-end.
One-Click CSV Export
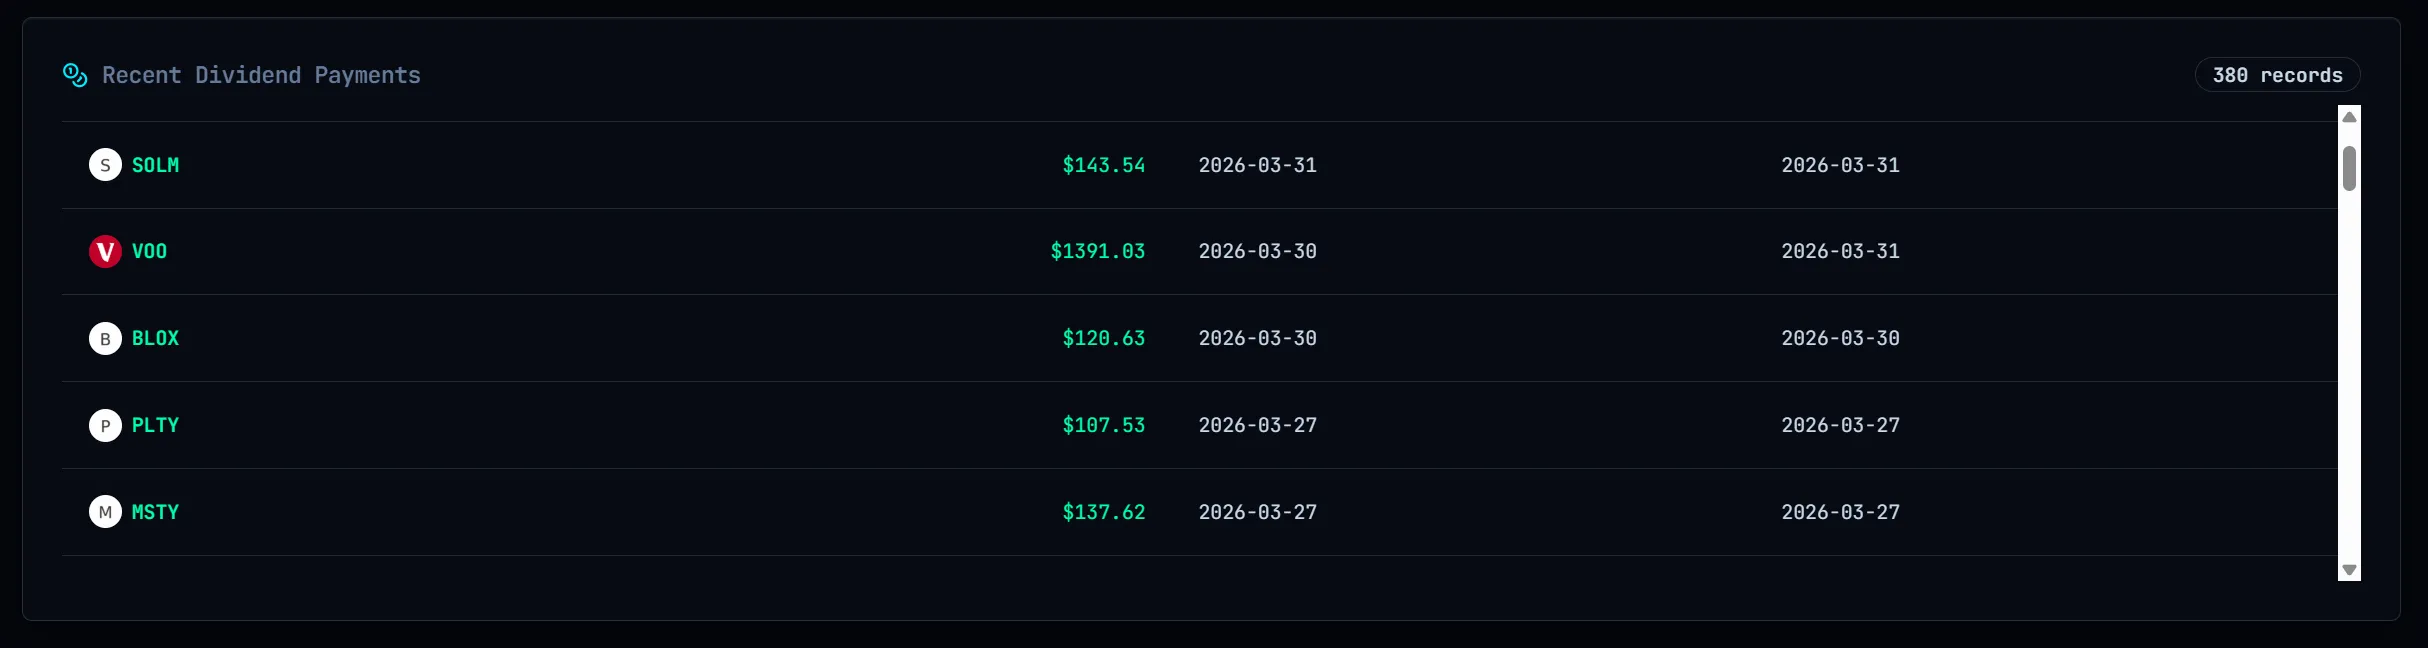
Combined dividend + premium payment history for the selected year — ex-date, pay-date, ticker, type, and amount. Ready for your accountant or tax software.
Year-over-Year Comparison
Dividends, option premiums, combined total, and estimated tax liability for every year side by side. Click any row to switch the year filter instantly.
Tax-Loss Harvesting Alerts
AI-assisted harvesting opportunities: dividend shield and premium offset alerts ranked by tax saving potential, with wash-sale lock tracking.